Cite this issue

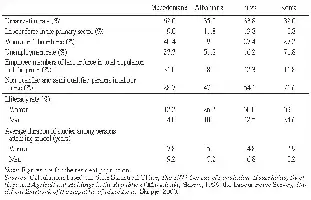

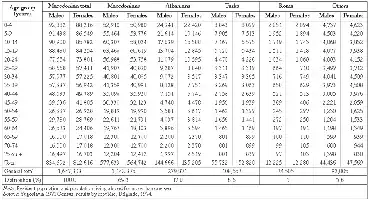
Comparison of the population of electoral age in 2002 and voting by ethnic group in the parliamentary elections of September 2002


Total fertility rate in European and eastern European regions, 1980-2000
Source: Council of Europe (2001, 2002).
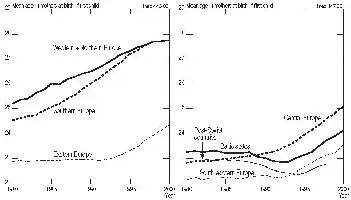
Mean age of mothers at birth of first child in European and eastern European regions, 1980-2000
Sources: Eurostat (2002, 2003), Council of Europe (2001, 2002), Toulemon and Mazuy (2001).

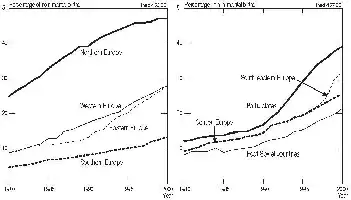
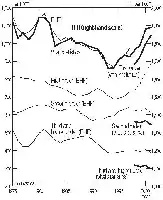
First-order TFR (TFR1) and mean age of mothers at birth of first child. selected countries, 1970-2001
Sources: Eurostat (2002, 2003), Council of Europe (2001, 2002), CNPS (1990-1997), CSU (2000b), FSU (1981-1989), GUS (1991-1995).

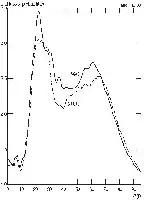
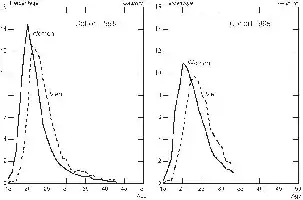
Age-specific fertility rates (ASFR) of women in selected countries and regions in 1989 and 2000
Sources: Eurostat (2002, 2003), Avdeev and Blum (2002), CNPS (1990), CSU (2000b), DASS (1999), GUS (1991), SB (1994, 2001) and unpublished national data.

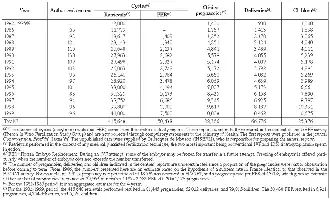
Total fertility rate (TFR), unadjusted and adjusted order-specific TFRs, and parity-specific indexes of total fertility (PATFR) for the Czech Republic and Romania in 1989-2000
Sources: data from CSU (2000a, 2000b), CNPS (1990-1997), and Eurostat (2003).

First births as a proportion of total births, 1988-2000 (in %)
Source: Council of Europe (2002).
Proportion of children born out of marriage in European and eastern European regions, 1980-2000 (in %)
Source: Council of Europe (2001, 2002).

Total first marriage rates (TFMR) of women in European and eastern European regions, 1980-2000
Source: Council of Europe (2001, 2002).

Extramarital births (in %) and proportion of women cohabiting at ages 25-29 in eastern European countries (various years)
Sources: FFS (1991-1998) and RHS (1993-1999) surveys (% of women cohabiting), Council of Europe (2000, 2001) for extramarital births.

Partnership status at birth of first child among women aged 20-24 with at least one child
Sources: FFS (1991-1998) surveys.


Current contraceptive use among women in union aged 25-29 in Central and Eastern Europe during the 1990s (in %)

Total fertility rate (TFR), unadjusted and adjusted by the Bongaarts-Feeney method, all birth orders and at birth order 1 (TFR1), 1990-2000

Relationship between change in mean age of women at birth of first child and percentage change in real wages. Central and Eastern European countries, 1989 to 1999
Sources: UNICEF (2001) for data on wages, Council of Europe (2002) for fertility data. Change in the mean age for Ukraine was estimated on the basis of the most recent data (1993) and trends in related indicators (mean age at childbearing and overall fertility rates by age) in the following period.


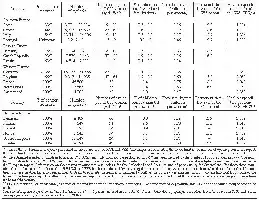

Use of assisted fertilization (measured by the number of cycles per 10,000 women aged 15-49 years) and demographic and economic indicators
Sources: European Report on In Vitro Fertilization 1998 (Nygren and Andersen, 2001b), Observatoire démographique européen, Eurostat Yearbook 2002 and Bilan démographique des pays développés (Sardon, 2002).

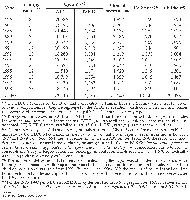
IVF success rate by age of woman, 1987-1996 (%)
Source: Data from FIVNAT (Contraception, Fertilité, Sexualité, 1997, 25(7-8), pp. 503-506, Table 2)
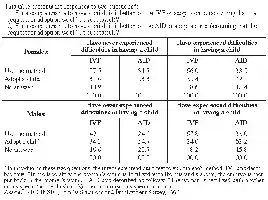
Acceptance of IFV and AID in France in 1994, by sex and experience or not of difficulties in having a child (%)

Proportion of conventional IVF and ICSI among in vitro fertilizations registered in FIVNAT, 1992-2000 (%)
Source: FIVNAT.

Numbers of conventional IVF, ICSI, and AID performed in France, 1986-1999
Sources: The annual number of AID (number of insemination cycles) comes from the annual reports of the CECOS Federation. The annual number of retrievals (including both conventional IVF and ICSI) comes from the centres’ activity reports. The estimate of the number of conventional IVF and the number of ICSI has been produced by applying the annual proportion of ICSI observed in the FIVNAT survey.

ICSI as a proportion of the IVF performed in twenty countries in 1995 and 1998 (%)
Source : World reports (see footnote 10).

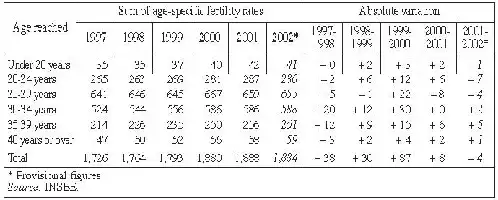
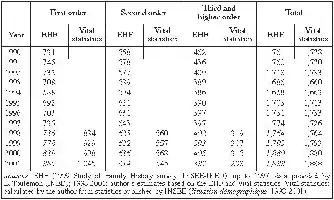
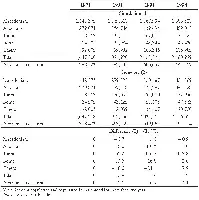
Order-specific decomposition of the total fertility rate (number of children per 1,000 women)
Order-specific decomposition of the total fertility rate (number of children per 1,000 women)
Source: See Table B.

Proportion of marriages involving at least one foreign spouse (per 100 marriages)
Source: INSEE, vital statistics.

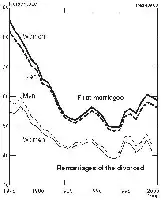
Total first marriage rates (sum of age-specific rates) and total rates of remarriage of the divorced (sum of rates by duration since divorce) (per 100 men or per 100 women)
Source: INSEE, vital statistics, and French Ministry of Justice.

Divorce probabilities for selected marriage durations since 1980 (per 1,000)
Sources: French Ministry of Justice and INSEE.


Estimate(1) of the final proportion of marriages terminated by divorce in the 1960-1990 marriage cohorts

Excess male mortality at each age, c.1990 and c.2000 (ratio of male probability to female probability)
Sources: INSEE, life tables for 1989-1991 and 1999-2001.


Cohort fertility: cumulative fertility to selected ages, estimated completed fertility (mean number of children per 100 women), and mean age of childbearing (in years and tenths of years)


Age at first union for men and women since the 1930 cohort
Source: INSEE-INED, 1999 EHF survey.
Age-specific rates of rates union formation in the 1955 and 1965 cohorts (per 100 men or 100 women of each age)
Source: INSEE-INED, 1999 EHF survey.

Period indicators of first union formation, and of first marriages for women, 1960-1998 (per 100 men or 100 women)
Source: INSEE-INED, 1999 EHF survey.

Proportion of unemployed young people aged 20-24 (per 100 men or 100 women of the same age), and period indicator of first union formation (sum of rates per 100, right-hand scale)
Source: Meron and Minni, 1995; INSEE-INED, 1999 EHF survey.

Proportions of men and women never having lived in union before age 50 by cohort (%)
Source: INSEE-INED, 1999 EHF survey.

Proportions of men and women reporting at least one union or marriage, and not giving date of entry into union (per 100 men or 100 women in each group of cohorts)

