Censuses, Elections and Population: the Case of Macedonia
- By Youssef Courbage,
- Translated by Ronald Wilkens
Pages 429 to 450
Cite this article
- COURBAGE, Youssef,
- Translated by WILKENS, Ronald,
- Courbage, Youssef.,
- et al.
- Courbage, Y.,
- Translated by Wilkens, R.
https://doi.org/10.3917/popu.304.0489
Cite this article
- Courbage, Y.,
- Translated by Wilkens, R.
- Courbage, Youssef.,
- et al.
- COURBAGE, Youssef,
- Translated by WILKENS, Ronald,
https://doi.org/10.3917/popu.304.0489
Notes
-
[*]
Institut National d’Études Démographiques, Paris.
Translated by Ronald Wilkens. -
[1]
Kristina Balalovska, Alessandro Silj and Mario Zucconi, Minority Politics in Southeast Europe: Crisis in Macedonia, Ethnobarometer, Rome, January 2002, 144 pages.
-
[2]
Organization for Security and Co-operation in Europe.
-
[3]
For the issues involved in this census and its organization, see Jean-Paul Sardon “Le recensement de 1994 dans l’ex-République yougoslave de Macédoine”, Population, 4-5, 2000, and Werner Haug, “Minorités en Europe : le droit d’être dénombré. Principes statistiques et cas pratique du recensement de la population de 1994 dans l’ex-République yougoslave de Macédoine”, presented at the conference on Anciennes et nouvelles minorités (Old and New Minorities), 8es Entretiens du Centre Jacques Cartier, Lyon, 5-8 December 1995.
-
[4]
Milica Zarkovic Bookman, The Demographic Struggle for Power. The Political Economy of Demographic Engineering in the Modern World, London, F. Cass, 1997.
-
[5]
This denomination designates the Roma who have chosen this term (resemblance between the substantives “Gypsy” and Egyptian).
-
[6]
Nathalie Clayer, “Islam et identité nationale dans l’espace albanais”, Archives de Sciences Sociales des Religions, July-September 2001, hhttp:// www. ehess. fr/ centres/ ceifr/ assr/ N115/008.htm (consulted in December 2002).
-
[7]
As long ago as 1760, the Archbishop of Skopje referred to the Albanians as “The race that reproduces the fastest—a single family will produce a hundred” (quoted by Michel Roux, Les Albanais de Yougoslavie. Minorité nationale, territoire et développement, Paris, Maison des Sciences de l’Homme, 1992).
-
[8]
According to Gjonça Arjan, “ Demography of Kosovo Before the War”, http:// www. seerecon. org/ OutsideSources/ KosovoDemography. pdf (consulted in December 2002).
-
[9]
Mention must be made of the part played by the Serbian Academy of Arts and Sciences, which encouraged Serbs to adopt a more active population policy and then recommended a negotiated separation in Kosovo.
-
[10]
Anica Dragovic, “Differentials of fertility in the Republic of Macedonia”, New Balkan Politics, 2000; Vasa Daskalovski et al., “Demographic aspects of natural increase in the Republic of Macedonia according to ethnic group”, International Conference, Sarajevo, 2000.
-
[11]
Article published in the magazine Utrinski vesnik, hhttp:// www. unitedmacedonians. org/ newspaper/oct00/demographics.htm (consulted in December 2002).
-
[12]
According to the website of the Dnevnik journal, quoting Dzemail Saiti, the Deputy Director of the Census Commission (of 2002).
-
[13]
Dudley Kirk, “Factors affecting Moslem natality”, in Bernard Berelson, Family Planning and Population Programs, Chicago, 1966.
-
[14]
Philippe Fargues, “Women in Arab countries: challenging the patriarchal system?”, Population et Sociétés, 387, INED, Paris, February 2003.
-
[15]
The incomes derive from transfers of savings from expatriate relatives in the Western European countries and from transfers in kind. They also derive from Macedonia’s exceptional geographical situation in the middle of the Balkans, which fuels various networks involving Albania, Kosovo and the former Soviet-bloc countries.
-
[16]
British Helsinki Human Rights Group, “Macedonia 2002 : Independence, R.I.P.?”, http:// www. bhhrg. org/ macedonia_2002. htmconsulted in December 2002).
-
[17]
Thanks to gifts from the billionaire philanthropist George Soros, another university, the South East European University, has been operating in Tetovo since 2001. This university is fee-paying but many students receive grants.
-
[18]
Milica Zarkovic Bookman, The Demographic Struggle for Power. The Political Economy of Demographic Engineering in the Modern World, London, F. Cass, 1997.
-
[19]
Youssef Courbage, “Surmortalité féminine chez les musulmans de Yougoslavie: islam ou culture méditerranéenne?”, Population, 46(2), 1991.
-
[20]
State Statistical Office, Natural Population Change in the Republic of Macedonia, Skopje, 2001; Marina Mijovska and Danica Miktovska, “The general characteristics of mortality in the Republic of Macedonia”, Demobalkan Conference, Sarajevo, 2000; Recent Demographic Developments in Europe – 2001, Council of Europe, Strasbourg, 2002.
-
[21]
United Nations, Manual III, Methods for Population Projection by Sex and Age, New York, 1957, pp. 47-50.
-
[22]
In 1972, for the whole of Macedonia, the total fertility rate stood at 3.01 infants per woman by the indirect method, whereas the rate calculated directly was 2.84. All the rates of the ethnic groups were reduced prorata by 2.84/3.01=0.944. For the Albanians, the 5.25 rate in 1969- 1974 (centred on 1972) was reduced to 5.25 x 0.944=4.95.
-
[23]
For the fertility schedules by age groups, see Council of Europe, Recent Demographic Developments in Europe – 2001, op. cit.
-
[24]
In Eastern Europe, the number of Roma recorded tends to be higher than the number expected on the basis of the previous censuses, because of a reduced propensity to conceal the Roma identity. This is far from the figures of 220,000-260,000 advanced for Macedonia alone by the Roma organizations and accepted by the NGOs, cf. ChildHope, Roma-The Current Situation, http:// www. childhopeuk. org (consulted in December 2002).
-
[25]
The total Macedonians and “others” gives almost identical figures for the census and the simulation: 1,495,000 and 1,491,000.
-
[26]
Figures obtained by applying the respective share of the two groups in the 1994 Census to 80,000.
-
[27]
The population aged 18 or over in 2002 was that aged 10 or over in 1994, excluding mortality. No account is taken of international migration for the period 1994-2002, since all Macedonians have the right to vote, whether they are resident in Macedonia or abroad. There were 1,664,000 on the electoral registers according to the Centre for South-East European Studies, Macedonia, cf. “SEC announced list of coalitions and parties that won parliamentary seats,” 19 September 2002, http:// www. csees. net/ news (consulted in December 2002).
-
[28]
The implicit affliliation is inferred from the fact that the candidates of any given party all belong to the same ethnic group. This was the case for the nationalist (VRMO) party and its coalition. As for the socialist party and its coalition, it presented only one candidate with a Turkish name. Albanian parties presented Albanians only.
-
[29]
In the previous elections, nationals living abroad did not have the right to vote.
-
[30]
This can be seen by comparing the total proportions of Albanians and Turks in the population with the votes received by the Albanian parties, especially in districts 1 and 2 (capital and surroundings).
-
[31]
Education in Macedonia, http:// faq. macedonia. org/ information/ education. html (consulted in December 2002).
-
[32]
Project on Ethnic Relations, State Policies Toward the Roma in Macedonia, Princeton, 2001.
-
[33]
Stemming from the aftermath of the 1999 war in Kosovo, when the victorious Albanians had taken reprisals against the Roma, guilty of collaborating with the Serbs.
-
[34]
Internet site of the Macedonian Albanians, Member of the Organization for Non- Represented Nations and Peoples (UNPO), http:// www. unpo. org/ member/ albans/ albans. html (consulted in December 2002).
-
[35]
31.5‰ among Palestinians, 12‰ among Jews according to the Central Bureau of Sta tistics, Statistical Abstract of Israel 2002, Jerusalem, 2002.
-
[36]
Paul Compton, “Catholic/Non Catholic Demographic Differentials in Northern Ireland”, in Werner Haug, Youssef Courbage, Paul Compton (eds.), The Demographic Characteristics of National Minorities in Certain European States, Council of Europe, Strasbourg, 1998. The Albanian configuration in Macedonia is like that in Northern Ireland where the Catholic mi nority has a higher fertility than the Protestants whose predominance it challenges, but higher also than that in the Irish Republic, where the level of development is less but where there are no minority problems.
-
[37]
Calculation based on Youssef Courbage, L’Afrique du Sud et ses populations, Population et Sociétés, 354, INED, Paris, February 2000.
-
[38]
John Bongaarts and Rudolf Bulatao, “Completing the demographic transition”, Population and Development Review, 3, September 1999.
1The question of population size is never absent from politics and can take a particularly acute form when different national, ethnic or religious groups are brought together in the same state. Numerical strength is the basis on which each group lays claim to political and administrative representation. Youssef Courbage here examines the case of Macedonia, one of the new states that resulted from the breakup of the former Yugoslavia. While awaiting publication of the detailed results of the November 2002 Census, the author undertakes an estimation of the population by ethnic groups, with particular focus on the Albanian minority. By combining several sources (censuses, election results, civil registration data) he estimates that in 2002 this group represented a quarter of the total population, a proportion slightly higher than that given by the 1994 Census, which has, however, been hotly disputed.
2Two censuses have been held in the former Socialist Republic of Macedonia since its separation and independence from Yugoslavia (1991). The first took place in 1994 and the second between 1 and 15 November 2002. The intercensal interval of only eight years is noteworthy for its shortness. Noteworthy too is the close international monitoring that accompanied these censuses. Repeating the experience of 1994, some fifty European observers travelled around the country for three weeks in order to verify the transparency of the census operations — a presence that could be thought excessive in view of the small size of the population, some two million inhabitants.
3Macedonia belongs to that group of countries or entities, often of recent creation, in which the question of number has disproportionate importance on account of the precarious nature of state structures and because national, ethnic or religious groups are competing for the political, material and symbolic resources linked to control of the state. The conflicts in Macedonia recall those in neighbouring formations such as Kosovo, where Albanians and Serbs were in conflict, and Bosnia-Herzegovina. Looking farther afield, however, other conflict situations can be mentioned: Northern Ireland in western Europe, Israel and Palestine or Cyprus in the Near East, or even South Africa during apartheid. The list is a long one and here we mention merely a few prominent cases, in each of which, despite the differences of context, demography is not a neutral factor but a crucial lever for the sharing out or conquest of power. In Macedonia, distrust between ethnic groups — in particular between the Macedonians and Albanians, who suspect each other of manipulating the numbers question — has taken hold since independence.
4The 2002 Census was held a few months after the "drôle de guerre" (phoney war) [1] which came to an end thanks to the Ohrid agreements, and a few days after the elections of 15 September 2002 which officialized the birth of the “new Macedonia” in accord with the spirit of those agreements. Signed on 13 August 2001, after pressure was applied notably by the European Union, NATO and OSCE [2], they ended an armed conflict between Macedonian troops and Albanian paramilitary forces (National Liberation Army) that had lasted from January to July 2001.
5The logic of demography underlies the Ohrid agreements. Because the results of the 1994 Census had been rejected by the Albanians, a second census, even more closely monitored by the international community, was laid down as a condition. Political and administrative representation had to be closely modelled on demographic representation. The agreements established a hierarchy of ethnic groups according to their demographic importance, with the 20% threshold having force of law. From being merely an ethnic minority, the Albanians became a main component in the structures of the nation and state. Albanian acquired, albeit not explicitly, the status of official language. Constitutional, legal, administrative, linguistic, university and other measures were aimed at reducing Macedonia’s “ethno-democracy” character and at making it “the state of all its citizens”. Regional demographies were also taken into account, to sanction decentralization of the state apparatus in favour of the 123 municipal districts, where minority groups were authorized to use their language for official purposes, on condition that the group represented more than 20% of the population.
6After presenting the main elements in the ethnic and religious composition of Macedonia (section I), we offer some explanations for the fertility differentials (section II). Although these contribute to produce variations in the different populations present, is there any evidence for the assertion that the first census after independence (1994) [3] was biased? We address the question of numbers by reference to a census carried out during the Yugoslav era (section III) and then to the free and internationally monitored legislative elections of 2002, which can be used for an indirect enumeration of these populations (section IV). We attempt to estimate the results of the 2002 Census, which have yet to be published (section V). We conclude by considering the lessons of the Macedonian experience.
I – A delicate balance
7By granting them a territory — the Federal Republic of Macedonia with its own (internal) frontiers — and recognizing the Macedonian language, Tito’s Yugoslavia established the Macedonians as a nation in 1945. For reasons connected to the delicate internal balance of Yugoslavia and in order to create an entity of viable size, Tito incorporated a significant portion of Yugoslavia’s Albanian population in Macedonia. More than a third of Macedonia’s population was made up of non-Macedonians. Having been cut off from the main core group in the independent Republic of Albania (1912), the Albanians of Macedonia were separated from the secondary core groups in Kosovo (an autonomous province of the Republic of Serbia), Serbia proper, and Montenegro. This was the source of the problem of Albanian irredentism that the Republic of Macedonia has had to face since independence. Compared with its neighbours, Macedonia has remained relatively free of such trouble despite the heterogeneity of its population (Table 1).
Population of the Macedonian republic by ethnic group and religion, 1994 census

Population of the Macedonian republic by ethnic group and religion, 1994 census
8Table 1 details twelve ethnic groups not counting the “others” and the “non-reported”. As in the whole of former Yugoslavia, ethnic group membership is based on self-reporting. Depending on time and circumstances, individuals may change their ethnic group. This is the reason for the movements observed between the small minorities, from Albanian to Turk and vice versa, Serbian or Vlach to Macedonian, Muslim Macedonian to Turk, and so on.
9But two ethnic groups, the Macedonians and Albanians, alone account for 90% of the population. Prior to its amendment by the Ohrid agreements, however, the Macedonian constitution of 1991 stated that “Macedonia is established as the nation state of the Macedonian people, in which full equality as citizens and permanent coexistence with the Macedonian people is recognized for Albanians, Turks, Vlachs, Roma and other nationalities living in the Republic of Macedonia”. This had the effect of putting the Albanians and the small ethnic groups on an equal footing. Yet Turks, Roma, Slavs (Serbs, Croats, Montenegrins, Bosnians, Muslims etc.) accounted for only one inhabitant in ten, and none of them came near the threshold of 100,000 inhabitants. The cleavage between Macedonians and Albanians is very real. Following the Ohrid agreements, therefore, the reformers of the Constitution gave the Albanians precedence over the other non-Macedonian ethnic groups.
10The religious category is more artificial. It is tempting to simplify the Macedonian mosaic by grouping all the Muslims in a single category [4]. Conversely, it is not uncommon to equate “Macedonianism” with the Orthodox Church. Muslims (600,000 persons, representing 30% of the population) are more numerous than Albanians. Almost all Albanians (except for 2% who are Christians, including the famous Mother Teresa), plus the Turks, Roma, “Egyptians” [5], Bosnians and “Muslims in the national sense” of Bosnia, are Muslims. This also includes 15,000 Macedonian Muslims, who consider themselves neither Albanian nor Turk. Macedonian Islam is not a sociological or political reality, but a simple statistical aggregate. It is divided by doctrinal questions and by the divergent, sometimes conflicting, interests of the various Muslim groups. As in Albania, the main Sunni branch (80%) cohabits with the periphery (20%) — the Bektashis and mystical brotherhoods [6], many of them syncretistic and derived from Shiite Islam.
11Group interests have priority over religious affiliation. The Albanians have a strong group consciousness, and they bolster this with an exceptionally high fertility.
II – Differential fertility
1 – The political background
12The exceptional fertility of Albanians has long been a subject of comment [7]. In Albania itself, with 2.10 children per woman in 1999, fertility remains high by European standards. Three years earlier it was still high enough to place the country with the Maghreb and Turkey rather than with the countries of Southern Europe. In Kosovo, Albanian fertility, which stood at 3.40 children per woman in 1996 [8], was 2.3 times higher than that of the Serbs. It was also higher than in Albania, where ethnic questions are non-existent.
13Since the creation of the Yugoslav Federation, and especially since independence, when an artificial frontier was set up between Albanians in Macedonia and those in Kosovo, the Macedonian Albanians have found themselves in a minority position vis-à-vis the Macedonian majority. Does this minority status affect demography, and more specifically fertility? Vice versa, will an increase in the Albanian component of the population consequent on its high fertility have repercussions in the political domain?
14Differential fertility was considered to be an important issue in Serbia and Kosovo [9], but not in Macedonia where, notwithstanding plentiful fertility data by ethnic group, the question has received less attention from analysts and has been less politicized [10]. The Macedonian language press has reported the unauthorized settlement of Albanian refugees from Kosovo or Sandjak (Serbia), but an article revealingly entitled "The demographists (sic) are warning of the danger of ethnic equilibrium among the population — self destruction of the Macedonian nation" contains no mention whatsoever of fertility [11]. While the Albanian language press has reported the high emigration of Albanians out of the country [12], it has remained silent on the subject of fertility.
2 – The factors of fertility
15The completed fertility of Albanian women is twice that of Macedonian women: 4.12 live births at ages 45-49 in the 1994 Census, as against 2.07. At the end of their reproductive life, the proportion of Macedonian women who have had 2 children is identical to that of Albanian women who have had 4–7 children. The most recent birth registration data indicate that the differences remain very large. In 2000, the crude birth rate of Albanians stood at 22.8‰, as against 10.6‰ for Macedonians. The singulate mean age at marriage is lower among Albanian women (23.3 years) than among Macedonian women (24.5 years) and permanent celibacy is lower (0.7% as against 3.1%). These figures partly explain the higher Albanian fertility. But the other proximate determinants of fertility (contraception, abortion, breastfeeding etc.) are not known. Rough calculations of marital fertility show it to be twice as high among the Albanians as among the Macedonians.
16It is easier to describe the proximate determinants of fertility than to explain its causes. A simple though certainly false explanation attributes the high fertility of the Albanians to their religion. Muslim doctrine has often been seen as pro-natalist and the high fertility of Muslim populations, which was real enough until the 1970s, interpreted as a result of Islam [13]. But this culturalist view ceased to be tenable once populations around the world, Muslim or not, became engaged in the fertility transition.
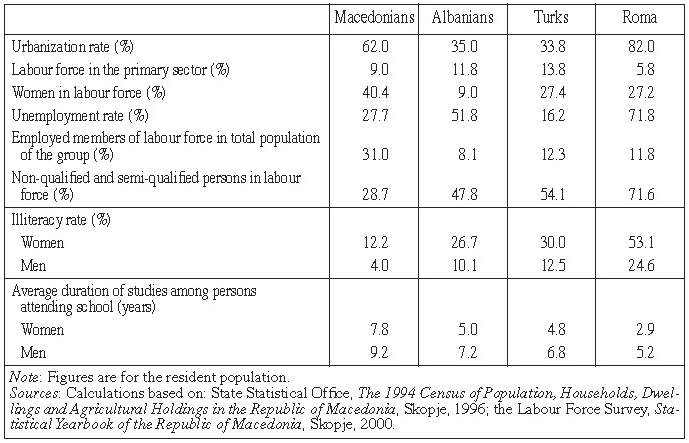
17Albanians living in Macedonia, Turks and Roma as well, possess a set of socio-economic characteristics which in synergy almost invariably induce high fertility (Table 2). Illiteracy, relatively low among Macedonian women (12%), remains high among Albanian women, with one in four unable to read or write. Gender inequalities remain large among Albanians: the gap between men and women is 17 percentage points (8 points among Macedonians). The discriminatory treatment of Albanian women emerges more clearly still from the short length of time they spend in school and university (for those who attend). Whereas the average time spent in education is eight years for Macedonian women, for Albanian women it is only five years. The result is that nine out of ten Albanian female school children have been unable to continue beyond primary education (compared with five out of ten of their Macedonian counterparts).
Socio-economic indicators by ethnic group, 1994
Socio-economic indicators by ethnic group, 1994
18Albanian women might, however, have been expected to close the gap with the other groups (Albanian men, and Macedonian men and women). With the advent of socialist Yugoslavia after 1945, the illiteracy rate among women born in the years 1939-1944 and who attended school after the Second World War fell by half in five years relative to that of the 1934-1939 generations.
19Whereas one Macedonian in three lives in the countryside, the figure for Albanians is two in three, one of the highest rural proportions in the world. The way of life is intensely rural, affecting even the Albanian districts of the towns. Many Albanians live in remote mountainous areas. But this way of life does not dictate the mode of production; only 12% of the labour force is in agriculture, barely more than among the Macedonians (9%).
20In addition to these easily quantifiable phenomena, the hypothesis can be made that the persistently high fertility of the Macedonian Albanians is related to the particular nature of their economic system, which is a form of rentier economy. Economies of this kind are usually based on sub-soil resources (oil and hydrocarbons in the Arab countries) or on a strategic geographical position [14], and allow material affluence to be disconnected from productive work. A demographic consequence of this is an absence of motivation to oppose the preference for large families.
21Unlike the inhabitants of the Arab oil-producing countries, the Albanians of Macedonia do not have a welfare state that redistributes the revenue from the sub-soil. Nevertheless, we submit, as a hypothesis for further investigation, that their mode of production has certain affinities with that of Arab populations before the fertility transition. The main difference is that revenue is redistributed not by the state but by individual expatriates or para-state organizations [15]. A vivid illustration is the private university at Tetovo [16], the main Albanian city, where study is almost free-of-charge and funding is provided entirely by benefactors from the Albanian diaspora [17].
22For the Macedonian Albanians, it is not just agricultural activity that is marginal; economic activity in general — in the conventional sense of the term — is a rarity. Beginning with that of the women. By choice, or through family pressure, they take no part in production (9% of women in the labour force, 40% among Macedonian women) and devote the time thus saved to raising their offspring. Female labour force participation is as low as in the conservative Arab countries (Saudi Arabia). Albanian men, themselves, are little involved in production and of those in the labour force, more are unemployed (51%) than employed. The absence of men and women from the productive sphere is particularly intriguing given that children, by definition not in the labour force, are very numerous. Overall, only one Albanian in twelve is economically active (one in three of Macedonians). Yet the generalized low level of activity among the Albanians seems not to impact on their standard of living. The Albanian economic sector increasingly resembles a rentier economy, in which incomes are unrelated to productive work. In this context, a large number of children, especially sons, is necessary to strengthen the clan. The transfers of savings from expatriates make it possible to overcome the material difficulties that might otherwise undermine the social preference for large families.
23In the next section we examine to what extent population trends between the Yugoslav era and that of independence are consistent with the high level of Albanian fertility and its persistently large difference relative to that of the Macedonians. In other words, are the breakdowns by ethnic group derived from the 1994 Census credible? The situation in more peaceful times, during the Yugoslav era, when these breakdowns were a less contentious issue, provides some guidance.
III – A basis for estimation: the 1971 Yugoslav census
24Yugoslavia had a long tradition of censuses (1953, 1961, 1971, 1981, 1991) and produced statistics covering ethnic group, language, and sometimes religion. Up to the death of Tito (1980), relations between the ethnic groups were far less tense than at present. The federal statistical offices did their work satisfactorily [18] and the data, in particular those from censuses, while perhaps not perfect, were adequate to perform the type of estimation that we present here.
25In Macedonia, more specifically, the Macedonians were grateful to Tito for having granted them their own identity (distinct from the Serb nation), while the Albanians were grateful to him for “forgetting” their collaboration — real or imagined — with the Axis powers during the Second World War. Though unable to realize their aspiration to full unity — compromised in any case by the existence of an independent Albania — they had obtained a form of recognition with the detachment from Serbia of the autonomous province of Kosovo, and more extensive rights than in the pre-war monarchist Yugoslavia. In the Republic of Macedonia, the Albanian and Macedonian groups were both minorities in a larger whole and did not really see themselves as rivals, which is, after all, a condition for reliability in a census. After the death of Tito in 1980, inter-ethnic relations deteriorated throughout Yugoslavia, especially in Macedonia, leading even to a boycott of the census by the Albanian community in 1991.
26If the Yugoslav censuses, or at least those from a certain period, are reliable, they can be used to estimate satisfactorily the population expected at a later date, such as that of the 1994 Census. Since the censuses of 1953 and 1961 are too old, our estimations are based on the 1971 Census (Appendix I). At that time, the Macedonians formed 69.3% of the population and the Albanians 17%.
27The analysis we perform here involves projecting from 1971 to 1994 the numbers by age and sex in the ethnic groups using the cohort components method. This simulation concerns persons resident in Macedonia, i.e. those presently living there or who emigrated less than one year ago, and those who emigrated more than one year ago. Thus it only makes assumptions about mortality and fertility.
28Mortality differences between the various ethnic groups have narrowed greatly, to the point that infant mortality rates in 2000 were almost identical: 9.9‰ among Macedonians and 10.8‰ among Albanians. The excess mortality at ages 0-4 of Albanians compared with Macedonians was compensated by a lower mortality above age 5. The disappearance of the high female excess mortality before age 5, which had marked the demography of Albanians during the Yugoslav era [19], is remarkable. Mortality does not have a decisive effect for a simulation extending over twenty or so years, so the life tables for the whole population of Macedonia have been applied to each ethnic group [20].
29A more delicate task was the reconstitution of the fertility rates for the period 1971-1994, which have a much clearer incidence than mortality on the projected numbers. Lacking a continuous series of fertility rates by ethnic group, we resorted to a backward projection [21]based on the distributions by age and sex from the 1994 Census, in quinquennial steps, and without taking into account infant mortality or that of women of reproductive age (see box).
Box: Projection of the population of Macedonia, 1971-1994, by ethnic group
- Calculation of births corresponding to children aged 0-4 years, 5-9 years… 20-24 years, in each of the five five-year periods counting backwards (1989-1994…1969-1974).
- For each five-year period, calculation of the number of women of reproductive age (15-49 years) at the two interval limits, and then their average at the mid-interval point.
- Calculation of the child-woman ratio between the number of children aged 0-4 years and that of women aged 15-49 years for each five-year period.
- Calculation of an approximation of the total fertility rate, equal to the previous child-woman ratio multiplied by 35 (length of the reproductive life span between 15 and 49 years) for the five five-year periods.
- Calculation of the fertility rates for the projection years 1971, 1976…1991, by linear interpolation from the five previously calculated periods.
- Calibration of the fertility rates of each ethnic group to make them consistent with those of the population of Macedonia as a whole [22].
- Projection of the survivors by age group and sex by the cohort components method, using the survival ratios of life tables assuming an identical improvement in life expectancy for the ethnic groups: from 67 years for males and 70 years for females in 1969-1974, to 70.5 years and 74 years respectively in 1989-1994.
- Projection of births using age-specific fertility rates. For each ethnic group and each projection year, the age-specific fertility rates were obtained from the total fertility rates in Table 3, and from the distribution given by the age-specific fertility schedule for Macedonia as a whole [23].
- Projection of the survivors from these births.
Total fertility rates by ethnic group, simulation 1971-1996 (number of children per woman)

Total fertility rates by ethnic group, simulation 1971-1996 (number of children per woman)
30This reconstitution suffers from certain drawbacks. It does not take into account the mortality of women and children, nor the changing age structure of the female population of reproductive age. Moreover, it is based on the 1994 Census (more particularly on some parts of the age and sex structure according to this census) whose completeness is precisely what we want to evaluate. In the end, it nonetheless appears fairly robust — the total fertility rates calculated in this way for the whole of Macedonia are consistently very close to those calculated directly.
31The difference between the results of the 1994 Census and those of this simulation (Table 4) is negligible for the Macedonians: their number is 0.9% higher in the census. The number of Roma is very close to the expected figure [24]. For the other groups, especially the Serbs and Vlachs, the numbers are lower than those expected, because of the process of assimilation (linguistic, matrimonial etc.) with Macedonians [25].
Population size, 1971-1994, by ethnic group, from the simulation and the censuses

Population size, 1971-1994, by ethnic group, from the simulation and the censuses
32The differences are considerable for the Albanians, whose numbers are higher in the 1994 Census than in the simulation — 484,000 instead of 470,000. For the Turks, the difference is very large — 83,000 Turks enumerated in the 1994 Census, or half the expected population of 177,000. This shortfall is observed in the other censuses — it cannot be attributed to out-migration from the country, since this is the de jure population within and outside the frontiers — and is a constant feature of the Yugoslav census-taking. In 1953, for example, Macedonia officially had more Turks (204,000) than Albanians (162,000). This is an instance of an imprecision frequent in the classification of ethnic groups.
33The boundary between the Turkish and Albanian ethnic groups is not impermeable. For reasons related to history — the long cohabitation between Ottomans and Albanians — and to the political situation in Yugoslavia — the anti-Albanian policy (1945-1966) — many Albanians, either by personal choice or from a desire to have the possibility of emigrating to Turkey, report themselves Turks. In 1971, the Turkish ethnic group still included many Albanians. By summing these two groups, the total according to the simulation for 1994 should have numbered 647,000 persons, as against 567,000 actually recorded in the census, i.e. 80,000 persons (14%) fewer.
34Omission in the 1994 Census seems therefore to have affected some groups more than others. But the scale of this omission has been exaggerated. It would appear to have involved only 68,000 Albanians and 12,000 Turks [26]. The number of Albanians (residents and expatriates) should thus have been 552,000 persons, or 25.2% of the population, rather than the 484,000, or 23.0%, yielded by the census.
35Is this omission confirmed by a more recent source? The previous stage of the analysis projected us forward from 1971 to 1994. The next stage projects us backwards from 2002 to 1994.
IV – Do the 2002 elections confirm the 1994 census?
36Although it is impossible to derive an irrefutable figure from electoral data, the results of the 2002 parliamentary elections can be used to confirm or invalidate the broad estimates obtained from the simulation carried out on the 1971 Yugoslav Census.
37The new electoral system adopted in 2002, based on proportional representation in the six electoral districts covering the whole territory, brought the electoral quotients of the Albanian parties more into line with those of the Macedonians. In 2002, between 8,400 and 8,800 votes were needed to elect a Macedonian candidate (governing party or opposition), and an average of 10,100 to elect a candidate from one of the four parties that were openly declared as Albanian or implicitly recognized as such. These four parties took 22% of the votes cast in 2002, a result very close to the Albanian share of the total population in 1994 (23%).
38But the comparability of the demographic and electoral figures is not this straightforward. Because the 2002 elections took place eight years after the 1994 Census, the comparison must be between the population of voting age and the electors [27]. Table 5 shows the share of the main ethnic groups in the electorate and the share of the votes cast obtained by the political parties according to their explicit or implicit ethnic affiliation [28].
Comparison of the population of electoral age in 2002 and voting by ethnic group in the parliamentary elections of September 2002

Comparison of the population of electoral age in 2002 and voting by ethnic group in the parliamentary elections of September 2002
39The percentage of votes obtained by the Albanian parties (22%) is very close to the proportion of Albanians in the population aged 18 and over in 2002 (aged 10 and over in the 1994 Census), i.e. 21.4%. Although the smallness of this difference is encouraging, some problems remain unresolved.
40Can the possibility of cross-voting be excluded? A tiny number of Albanians may have voted for Macedonian parties and vice versa, but as in any country where ethnic identity is paramount, people vote for the parties of their own group. Another difficulty concerns the turnout rates of Albanians and Macedonians. The overall turnout in the September 2002 election was high (72.6%), because the Albanians did not boycott it. The most successful Albanian party, the Democratic Union for Integration, had been quick to change its tactics following the Ohrid agreements, switching from armed struggle to the language of the ballot box. But the Albanians voted slightly less than the Macedonians, partly because a larger proportion of them lived outside Macedonia. Some individuals were reported to have returned to the country to vote, but this was not a mass movement. Nationals living abroad are very unlikely to have rushed to the polling stations, unless they lived close to Macedonia [29]. In district six, which corresponds broadly speaking to the Albanian region (Tetovo, Gostivar, Debar and Kicevo), the level of turnout was good, although below the average (66.1%).
41The relative shortfall in the electoral turnout of the Albanians could have been in the region of 10% at most. This is the difference between the turnout in district six (66.1%), where Albanians number seven in ten, and that in a uniformly Macedonian district, district four (76.1%), where Macedonians account for 93%. This suggests that Albanians are more numerous in the electorate, and hence in the total population, than is indicated by the projection based on the 1994 Census results.
42On the other hand, some Turks, Roma and Bosnians voted for the Albanian parties, and this reduced the effect of the lower Albanian turnout. Motivated less by “Islamic” solidarity than by political calculation, the Turks did not present a list, while very few Roma and Bosnians voted for their own parties. Many of them chose an Albanian party [30]. As noted earlier, in the former Yugoslavia the Turkish and Albanian identities are still not completely watertight. The Turks, who lacked the option of voting for a Turkish party, not present in these elections, may have voted for an Albanian party. Grievances against the authorities were combined with distrust of the Macedonian parties of right and left. The Turks demand teaching in the Turkish language for their children, which, though guaranteed by the Constitution, remains symbolic (36 primary schools, 4 secondary schools [31] and no university course in Turkish). The Roma have the same demands, in addition to their age-old marginalization, which they blame on a state identified with the Macedonian ethnic group [32].
43But this does not mean that relations between Roma and Albanians are problem-free [33]. At a more general level, the small minorities (Turks, Roma et Bosnians) have an ambivalent attitude. They fear the transformation of Macedonia into a bi-national state — as it is becoming de facto —where they risk being submerged in the confrontation between Albanians and Macedonians. They could therefore be tempted to slow the Albanian progression by not voting for the Albanian parties or even choosing the Macedonian parties instead.
44Returning to the demographic issue, the lower electoral turnout of the Albanians suggests the proportion of Albanians in the population aged 18 or over and in the total population is higher than according to the results carried forward from the 1994 Census. By applying the differential turnout rate of 10%, the Albanian population aged 18 or over would represent 24.2% of the total population of the same age, instead of 22%. Allowing for their younger age structure, Albanians would form 25.8% of the total population. In the opposite direction, a fraction of the Turkish, Roma and Bosnian vote (estimated at a maximum of 6% of their 6.8% in the population of an age to vote) increased the votes obtained by the Albanian parties. When these compensations are allowed for, the proportion of Albanians aged 18 or over would come to 22.7% and, adjusting for their young age structure, to 24.3% in the total population. Using another method, therefore, the result is close to that obtained at the end of the preceding section (25.2%). In sum, the underenumeration of Albanians appears small in scale, far short of that claimed by the Albanian organizations, who maintain that 40% of the population is Albanian [34]. The 2002 Census will cast more light on the issue.
V – From one census to another, forecasts for 2002
45The preliminary results of the November 2002 Census, initially planned for January 2003, will give only the total population, not the breakdown into ethnic groups. This sensitive data, by far the most keenly awaited, calls for careful handling and is quite long to process. We therefore propose a population estimate by ethnic groups in November 2002, based on our calculations for 1994 and on the natural increase recorded between 1994 and 2002 (Table 6). On these assumptions, in a total population of nearly 2.3 million inhabitants (November 2002), Albanians would number between 580,000 and 620,000 persons, i.e. between 25.8% and 27% of the population. This is far from the 40% that they claim. The 3 or 4 extra percentage points compared with the 1994 Census result partly from a slight underenumeration in that census but mostly from recent natural increase, which is much higher than for the Macedonians. Between 1994 and 2002, the crude birth rate of Albanians (20.7‰) was twice that of Macedonians (10.2‰) while their mortality rate was half as high (5.1‰ against 8.8‰), leading to a rate of natural increase ten times higher — 15.6‰ as against 1.5‰. Two-thirds of the natural increase in the country are due to the Albanians, who represent barely a quarter of its population.
Estimation of population by ethnic group, November 2002 (in thousands)

Estimation of population by ethnic group, November 2002 (in thousands)
Overview and conclusions
46By the standards of the rest of the world, including the Third World, Albanian fertility has fallen little and it remains substantially different from that of the Macedonians. Geographical isolation, deficiencies in the educational system, and imperfect access to the employment market explain these disparities, but only in part. But politics is also involved. The Albanians of Macedonia, who believe they are more numerous than the censuses record, imagine that majority status is within their grasp. They may be taking Kosovo as a model. In that province, which at different times was Ottoman, Austrian, Yugoslav and then Serb, the only constant factor has been inexorable demographic growth among the Albanians. It prepared the ground for the political changes that culminated in quasi-independence in 1999.
47The Albanian population possesses two other advantages: it is young and its mortality is low. This is the source of a difference in natural increase between two ethnic groups sharing a single country that is unique in the world: ten times higher among the Albanians than among the Macedonians. As a comparison, natural increase of Palestinians is only three times that of Jews in Israel [35], 3.8 times higher among Catholics than Protestants in Northern Island [36], and 4 times higher among Blacks than Whites in South Africa [37]. The possibility that the Albanians will one day, before the end of this century, reach parity with the Macedonians is therefore very real, even though they currently form only a quarter of the population.
48The Bongaarts and Bulatao model [38] can be used to illustrate this point without resort to projections that are still premature. Given the demographic momentum created by the low age of the Albanian population, which ensures it a growth multiplier over the coming years of 1.56 as against 1.11 for the Macedonian population, and despite fertility forecasts that we have deliberately set in a sense unfavourable to the Albanians (sharp decline and convergence with the Macedonian total fertility rate in 2050 at 1.90 children per woman, then parallel increase to 2.10 in 2075), numerical parity between Albanians and Macedonians could be reached in 2075, with each group then forming 44% of the population. But neither group would be in the absolute majority at that date (see Appendix 2).
49There is therefore no need to dispute the 1994 Census so fervently, as will no doubt also happen for the 2002 Census when its results are published.
Population of Macedonia by age group, sex and ethnic group, 1971

Population of Macedonia by age group, sex and ethnic group, 1971
Bongaarts and Bulatao’s model applied to the population of Macedonia, 1994-2075

Bongaarts and Bulatao’s model applied to the population of Macedonia, 1994-2075

This article is available in open access under our model Subscribe To Open.