Austerity Policies and Politics: The Case of Portugal
- By Catherine Moury
- and André Freire
Pages 35 to 56
Cite this article
- MOURY, Catherine
- and FREIRE, André,
- Moury, Catherine.
- et al.
- Moury, C.
- and Freire, A.
https://doi.org/10.3917/psud.039.0035
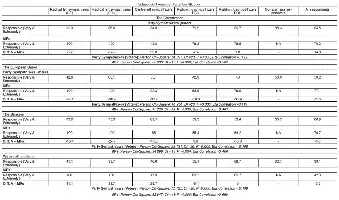
Who should be blamed for the economic recession in the past two years? (column percentages) – Party Sympathizers (Voters) & MPs by party list
Note: NA = Not Applicable.
Source: 2012 Mass Survey (taking into account the 2011 Census Data – INE 2011 – the sample was weighted by region, sex, gender and education); 2012-13 MP Survey (the sample was weighted taking into account the constitution of the assembly at 1st March 2012 to correct for any significant deviances), 2011 Elections.

Evaluation of the Bailout agreement signed by the Portuguese socialist government (and rightwing parties) with the Troika (IMF, EC and ECB) & Debt renegotiation (column percentages) - Party Sympathizers (Voters: V) & MPs by party list
Note: The absolute numbers and percentages vis-à-vis the total number of persons interviewed in each sample (N= 1209, for citizens, N = 123, for MPs) is the following. For citizens broke down by party identification: CDU/PCP: 84 (7.3%); BE: 92 (.0%); PS: 254 (22.0); PSD: 115 (10.0%); CDS-PP: 16 (1.4%); Non-partisans: 592 (51.3%). For MPs, broken down by the party within which they were elected, CDU/PCP: 10 (out of 16: 62.5%); BE: 8 (out of 8: 100%); PS: 36 (out of 74: 48.6%); PSD: 53 (out of 108: 49.1%); CDS-PP: 16 (out of 24: 66.7%). The later sample was weighted by party list and sex to correct for deviances vis-à-vis the Parliament in March 2012.
Source: 2012 Mass Survey (taking into account the 2011 Census Data – INE 2011 – the sample was weighted by region, sex, gender and education); 2012-13 MP Survey (the sample was weighted taking into account the constitution of the assembly at 1st March 2012 to correct for any significant deviances) – 2011 Elections.
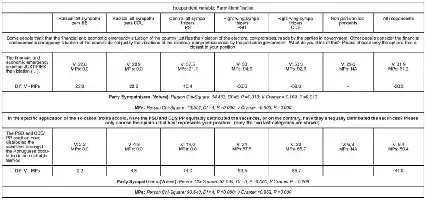
Level of responsibility of the current government for not filling electoral commitments and equality in the distribution of sacrifices related with austerity (column percentages) - Party Sympathizers (Voters: V) & MPs by party list (due to space limitations only the first category of answer in each question is shown)
Note: NA = Not Applicable.
Source: 2012 Mass Survey (taking into account the 2011 Census Data – INE 2011 – the sample was weighted by region, sex, gender and education); 2012-13 MP Survey (the sample was weighted taking into account the constitution of the assembly at 1st March 2012 to correct for any significant deviances), 2011 Elections.