Finance as a driver of growth? Evidence from EU countries
Pages 571 to 586
Cite this article
- MATEI, Iuliana,
- Matei, Iuliana.
- Matei, I.
https://doi.org/10.3917/redp.244.0571
Cite this article
- Matei, I.
- Matei, Iuliana.
- MATEI, Iuliana,
https://doi.org/10.3917/redp.244.0571
1. Introduction
1 This paper is a contribution to the debate on whether there is a relationship between finance (via bond market) and economic growth in 26 countries of European Union. It looks at countries belonging to the euro area as well as to non-euro area members. Most part of the studies have analyzed in great detail this relationship for the financial intermediaries (e.g., Berthélemy and Varoudakis [1997]; Levine, Loayza and Beck [2000], Loayza and Ranciere [2006]) as an essential resource of funding for economic growth. But, little attention has been paid to bond financing despite considerable growth in the recent period particularly in developing countries (Gruic and Woodrige [2012]).
2 The role of financial services in promoting and enhancing economic development dates back to Schumpeter [1911, 1934]. For Schumpeter, spending a credit on innovative investments rather than on increasing consumption is fundamental for the development of a competitive capitalism; the capital is considered as a source of financing purchasing power. The importance of financial intermediation in increasing savings in the most productive investments was also pointed out by Goldsmith [1969], McKinnon [1973], Shaw [1973], Harvey [1989], King and Levine [1993]. For a number of other authors, this positive link between finance and growth does not necessarily suppose that finance causes growth but it rather follows economic growth (Robinson [1952], Coase [1956], Lucas [1988]). Differently, Patrick [1966] highlights the instability of this debated correlation and explains it by the stage of development of the country: at the initial stage, financial development leads to economic growth while as real growth takes place in the economy, this linkage becomes less important and growth will enhance the demand for financial services. According to his approach, as the economy grows, it involves additional and new demands for financial services whilst the financial system responds automatically to these kinds of demands. From his point of view, the lack of financial institutions in underdeveloped countries simply indicates the lack of demand for such services. Opposite views were identified by Patrick [1966] as relying on the supply-leading, the demand-following and the interdependence hypothesis. Recent empirical literature adds to this list new hypothesis: negative causality from finance to growth and no causal links between them.
3 These five hypotheses have been analyzed in a large number of empirical studies to assess the quantitative importance of the financial system (via mainly banking sectors) for economic growth. Even if the finance-growth nexus is commonly admitted, there is no consensus regarding the direction of causality. One possible explanation is that studies are based on different groups of countries, diverse time horizons and empirical methods. The main empirical researches focus on three types of regressions studying the finance-growth link: cross-country specifications with or without panel techniques (e.g., Goldsmith [1969], King and Levine [1993a, b]), time series studies (Gupta [1984]; Demetriades and Hussein [1996], Arestis and Demetriades [1997], Fink, Haiss and Hristoforova [2003] and panel studies (e.g., Berthélemy and Varoudakis [1997]; Beck, Levine and Loayza [2000], Loayza and Ranciere [2006]).
4 This paper adds to this empirical literature by applying a recent panel approach to the issue of causal linkages between bond market (via a term spread) and economic growth. The analysis is performed over three periods: the whole period (2002-2012), the pre-crisis tranquil period (2002-2008) and the crisis-period (2008-2012) for 26 European Union members. Dynamic panel estimation techniques have been employed to eliminate the problems of cross country studies. Panel specifications allow for financial development and growth determinants that are time-invariant unobserved country characteristics to be controlled. Fixed effects panel techniques are subject to less endogeneity problems. Heterogeneous country effects are also allowed meaning that financial development has different effects across countries. In this paper, the short-run coefficients vary across countries whilst the long-run factor remains the same. In addition, the non-stationarity issue is tackled here by the bias of the mean-group estimator (Pesaran and Smith [1995]). It should be noted that some empirical models that forecasts output growth based on the term spread provide evidence in favor of structural breaks in data (Stock and Watson [2002], Estrella, Rodrigues and Schich [2003]). However, theory suggests (e.g., Estrella [2005]) that there is a persistent predictive link between the slope and future growth, although the precise parameters may change over time. Our results find evidence in favor of a positive impact of the term spread on economic growth in the case of euro area countries and of a negative impact on growth in the case of Emerging Europe. Furthermore, growth rates influence negatively the term spread in all selected countries (EMU and non-EMU). The first finding supports the idea that the economic activity may be positively influenced by the dynamics of the bond markets (the supply leading view for EMU’s members but a negative link for Emerging Europe) while the second finding explains that bond market expansion may be endogenously determined by real economy needs (the demand following channel).
5 The reminder of the paper is structured as follows. In the next section, we present our data and the econometric methodology. Section 3 reports the empirical results. Section 4 offers some concluding remarks.
2. Data and econometric methodology
2.1. Data and variables
6 The data panel includes observations from 26 European EMU and non-EMU members and covers the 2002-2012 period. We take into account all EMU and non-EMU countries for which the European Central Bank (ECB) publishes sovereign bond yields, i.e. all EMU and non-EMU members except Estonia. Our panel also includes real growth rates from Eurostat database and the euro area yield curve spot rate (one year maturity, accounting for all issuers whose rating is triple A) from Datastream database.
7 The slope of the yield curve (computed as the difference between the yields on long-term and short-term Treasury securities) captures information about the future economic performance of the economy (e.g., Harvey [1989, 1991]). The inclusion of the short-term yield of euro area aims also to capture that euro becomes the “natural anchor” for the European non-EMU countries (Kocenda, Maurel and Schnabl [2013]) after 1999 and allows for the comparability between the estimated results.
8 We employ monthly data on yields provided by the ECB and take quarterly averages. For these countries, we also employed quarterly data of the GDP growth from 2002: Q1 to 2012: Q4 period to capture the state of the economy. Our panel includes the following ten non-EMU countries: Bulgaria, Cyprus, Czech Republic, Hungary, Lithuania, Latvia, Poland, Romania, Slovakia, Slovenia, and sixteen euro area members (Austria, Belgium, Cyprus, Finland, France, Germany, Greece, Italy, Ireland, Luxembourg, Malta, Netherlands, Spain, Slovenia, Slovakia and Portugal). The set of non-EMU countries includes only emerging countries (Emerging Europe). Therefore, the panel includes countries with diverse stages of economic development and accordingly, with different structures of country’s financial system which allows for robust empirical estimations. Because some of non-EMU countries (Cyprus, Malta, Slovakia and Slovenia) became euro area members after 2008, they are including in both samples.
9 Figures 1 and 2 display the scatter plots of the quarterly term spread and the real GDP growth for Emerging Europe, respectively, for the EMU countries for the whole period. Figures indicate differences in the bond behavior and growth rates that may be justified by the financial crisis of 2008. The imbalances between EMU or non-EMU members still persist especially during the recent crisis period and may reflect investors’ beliefs regarding the market risks. As concerns the evolution of growth rates, it is clear that almost all EU economies faced severe growth contractions because of the financial crisis of 2008 and the European sovereign debt crisis of 2010.
The evolution of the term spread and GDP growth rates in EU countries

The evolution of the term spread and GDP growth rates in EU countries
Note: The Y scale represents the term spread while the X scale represents the GDP growth rates.2.2. Methodology
10 The empirical analysis intends to disentangle the long-run and short-run effects of bond markets on economic growth (and vice-versa), which may, possibly, bring together the strands of the literature previously exposed: the supply leading and respectively, the demand following channels and possible interactions between them. For this purpose, we use the Mean Group (MG) and the Pool Mean Group (PMG) estimators (Pesaran and Smith [1995], Pesaran, Shin and Smith [1999]). Compared to Arellano and Bond [1991] estimator which requires pooling of individuals and allows only the intercepts to differ cross countries, the PMG estimator permits the long-run homogeneity without making the assumption of identical short-run dynamics in each country.
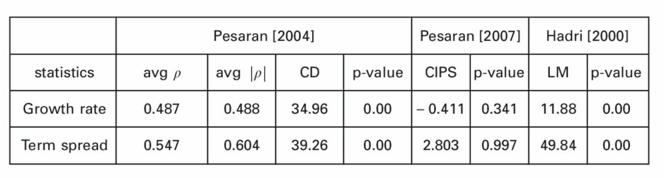
11 Before applying the MG and the PMG estimators, we have to check for the stationarity and the cointegration of our variables. To choose the appropriate tests, it is necessary to verify the dependence hypothesis between the countries of the panel. Strong inter-dependencies between cross-sectional units may arise because of the presence of common shocks (e.g., financial shocks, oil shocks and so on) that may impact differently the countries. To this end, we apply the Pesaran [2004] test which allows best sample size properties when the number of periods exceeds the number of countries. Since test results strongly reject the null hypothesis of no cross-sectional dependence for both variables in levels (term spreads and growth rates, see tables 1 and 2), we can check for their stationarity (i.e., for the order of integration of the series) by employing second – generation unit root and cointegration tests (see Hurlin and Mignon [2006] for a review). As second-generation panel unit root tests, we use the Peseran [2007] test and the Hadri [2000] test. Results show that quarterly growth rates and term spreads are non-stationary on the whole period. Furthermore, we explore the cointegration between our variables by using the Westerlund [2007] cointegration test. This second generation cointegration test show evidence of cointegration between the term spreads and growth rates for at least one of the countries (Gt and Ga) but also for the panel as a whole (Pt and Pa). Since the panel combines non-stationary and cointegrated data, it is possible to apply a dynamic vector error correction model to infer the causal linkages between the term spreads (tsit) and economic growth (gdpit).
Panel unit root and cointegration test results for euro area countries: 2002-2012
| Pesaran [2004] | Pesaran [2007] | Hadri [2000] | ||||||
| statistics | avg ? | avg |?| | CD | p-value | CIPS | p-value | LM | p-value |
| Growth rate | 0.487 | 0.488 | 34.96 | 0.00 | – 0.411 | 0.341 | 11.88 | 0.00 |
| Term spread | 0.547 | 0.604 | 39.26 | 0.00 | 2.803 | 0.997 | 49.84 | 0.00 |
| Westerlund [2007] | ||||||||
| Statistics – 1 lag | Gt | Ga | Pt | Pa | ||||
| Value/p-value | – 3.605 (0.00) | – 26.094 (0.00) | – 15.260 (0.00) | – 29.482 (0.00) | ||||
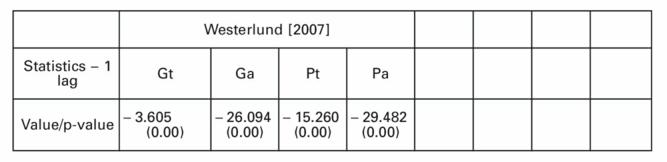
Panel unit root and cointegration test results for euro area countries: 2002-2012
Note: i) the Westerlund [2007] statistics are for the models with constant only; but statistics for models with constant and trend are qualitatively similar; the p-values are based on the normal distribution; ii) average AIC selected lag length is one and zero leads; iii) variables are in levels.Panel unit root and cointegration test results for Emerging Europe: 2002-2012
| Pesaran [2004] | Pesaran [2007] | Hadri [2000] | |||
| statistics | avg ? | avg |?| CD | p-value | CIPS p-value | LM p-value |
| Growth rate | 0.522 | 0.522 33.40 | 0.00 | 0.107 0.543 | 37.256 0.00 |
| Term spread | 0.261 | 0.456 16.72 | 0.00 | – 0.856 0.196 | 15.767 0.00 |
| Westerlund [2007] | |||||
| Statistics – 1 lag | Gt | Ga Pt | Pa | ||
| Value/p-value | – 3.369 (0.00) | – 24.342 – 13.604 (0.00) (0.00) | – 26.780 (0.00) | ||
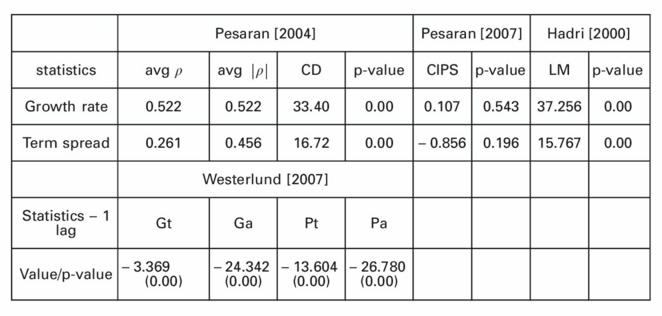
Panel unit root and cointegration test results for Emerging Europe: 2002-2012
Note: i) the Westerlund [2007] statistics are for the models with constant only; but statistics for models with constant and trend are qualitatively similar; p-values based on normal distribution; ii) average AIC selected lag length is one and zero leads; iii) variables are in levels.12 The general structure of the empirical model consists in an autoregressive distributive lag (ARDL) (p, q1, q2, ..., qk) dynamic specification of the form:

13
where the number of groups i = 1, 2,..., N (in the model, i = 16 EMU countries
and, respectively, i =10 Emerging Europe), the number of periods t = 1, 2,...,
T (for the whole period, T = 43 trimesters), Xit is a k × 1 vector of explanatory
variables, 
14 We re-parameterize (1) into the following error correction equation which allows for estimating the dynamic panel using mean-group (MG) and pooled mean group (PMG):

15
Where


16
In the equation (2) ?i is the error-correcting speed of adjustment term and
is expected to be significantly negative. If ?i = 0, then, there would be no
evidence for a long-run relationship. The vector
17 The error correction model that we will estimate is given by the following equations:

?jq=?01?i?j *?gdpi, t ? j+ ?i+ ?it[3]

?jq=?01?i?j **?tsi, t ? j+ ?i?+ ?i?t[4]
18
The PMG estimator permits to evaluate two different Granger causality relationships: a short-run causality by testing the significance of the coefficients
related to the lagged difference variables (


3. Empirical results and discussion
3.1. Econometric results for the euro area countries
19 This section presents the results from the pooled mean-group (PMG) for the equations (3) and (4). The PMG model allows for heterogeneous short-run dynamics and common long-run growth elasticity. Tables 3 and 4 report the results based on the PMG estimator with the long-and short-run parameter estimates for the whole period (column 2), the pre-crisis period (column 3) and the crisis period (column 4). The tables 5 and 6 present the findings by applying the mean group estimator (MG) also for the entire period and, respectively, for the sub-sample periods.
PMG model: long-run and short-run estimates for EMU (dep. var., term spread)
| Whole period | Pre-crisis-period | Crisis-period | |
|
Long-run term – Growth | – 1.684*** (0.515) | – 2.109*** (0.645) | – 0.359*** (0.092) |
| Error correction term (EC) | – 0.063*** (0.014) | – 1.327*** (0.012) | – 0.167*** (0.061) |
| Short-run term – | – 0.075** (0.038) | – 0.228*** (0.041) | – 0.061 (0.063) |
|
?Growth Constant | 0.172*** (0.041) | – 0.398*** (0.040) | 0.363*** (0.081) |
| No. obs. | 672 | 400 | 272 |
| No. groups | 16 | 16 | 16 |

PMG model: long-run and short-run estimates for EMU (dep. var., term spread)
Note: EC – the speed of adjustment coefficient, * p<0.10, ** p<0.05, *** p<0.01PMG model: long-run and short-run estimates for EMU (dep. variable, growth)
| Whole period | Pre-crisis-period | Crisis-period | |
|
Long-run term – term spread | 0.099** (0.042) | 0.073*** (0.028) | 0.101* (0.059) |
| Error correction term (EC) | – 0.615*** (0.081) | – 0.981*** (0.080) | – 0.606*** (0.071) |
| Short-run term – | – 0.100** (0.049) | – 0.173*** (0.052) | 0.353** (0.180) |
|
? term spread Constant | 0.144** (0.067) | 0.617*** (0.128) | – 0.187*** (0.064) |
| No. obs. | 672 | 400 | 272 |
| No. groups | 16 | 16 | 16 |

PMG model: long-run and short-run estimates for EMU (dep. variable, growth)
Note: EC – the speed of adjustment coefficient, * p<0.10, ** p<0.05, *** p<0.0120 In the output, the estimated long-run growth elasticity is significantly negative (at 1 % level) for all selected periods. In the crisis period, the long-run coefficient of the GDP growth is negative and significant, suggesting that faster growing countries pay lower short-run interest rates (1 percentage point higher real GDP growth leads to 35 basis points average decrease in the term spread). Overall, the links between the term spread (spreadit) and growth (growthit) has considerably weakened in euro area members in the crisis period. The speeds of adjustment coefficients are negative and significant for all three selected periods suggesting signs in favor of a convergence process towards the long run equilibrium (note that the response of the coefficient to the deviation from the long-run equilibrium is greater in the crisis period). Furthermore, short-run coefficients are statistically significant only during the pre-crisis period and whole period. Overall, these results have to be taken as evidence for long-run causality from economic growth to bond market (thus, for the demand following view).
21 The estimation results in which the term spread is the independent variable, are presented in tables 4. The estimated long-run term spread coefficient is positive and statistically significant (at 1 %, 5 % and 10 % level) for all three considered samples. The term spread affects positively and significantly growth rates of euro area countries. The fact that bond market changes are found to influence real economic activity postulates the supply-leading view assuming that the creation of financial institutions, bond market developments and accumulation of financial assets may generate economic growth (e.g., Levine [1997], Arestis and Demetriades [1997]). It also reflects that financial reforms may influence favorably economic growth. The error correction terms (the speed of adjustment coefficients) are found negative and statistically significant in all cases suggesting a convergence process towards equilibrium and the long-run causality.
22 The MG models estimated in tables 5 and 6 are displayed as a two equation model: the normalized cointegration vector and the short-run coefficients. In comparing the PMG and MG models, we note that the estimated long-run growth elasticity is statistically significant at 5 % level for the whole period when the growth rate is the independent variable and, respectively, for the whole period and the crisis period, when the term spread is the explicative variable. Furthermore, the PMG estimate of the growth elasticity is greater in magnitude than the estimate from the MG model for the whole period (– 1.68 for the PMG and – 1.87 for the MG estimator). The situation is quite different during the crisis period when the impact is greater but positive and non-significant for the MG estimator. In the MG model, bond market changes positively influence real growth highlighting again the supply-leading view. We also perform tests of difference in these models using the Hausman test. The Hausman test favors the PMG model against the MG model for all three considered periods (results upon request). One possible explanation of this outcome is that although the MG is a consistent estimator, it is not good enough when either N or T is small (Pesaran and Smith [1995]).
| Whole period | Pre-crisis-period | Crisis-period | |
|
Long-run term – term spread | 0.247*** (0.060) | 0.072 (0.048) | 0.684*** (0.174) |
| Error correction term (EC) | – 0.670*** (0.078) | – 1.030*** (0.082) | – 0.721*** (0.072) |
| Short-run term – | – 0.192*** (0.060) | – 0.209** (0.096) | 0.043 (0.150) |
|
? spread Constant | – 0.068 (0.112) | 0.642*** (0.192) | – 0.655*** (0.214) |
| No. obs. | 672 | 400 | 272 |
| No. groups | 16 | 16 | 16 |
|
Hausman mg pmg Prob>chi2 | 9.78 (0.002) | 0.00 (0.991) | 10.37 (0.013) |

MG model: long-run and short-run estimates for EMU (dep. var., term spread)
| Whole period Pre-crisis-period | Crisis-period |
| Long term – growth – 1.8705** (0.832) – 1.021 (1.308) | 3.3776 (9.431) |
|
Error correction – 0.0888*** (0.018) – 0.1375*** (0.017) term (EC) | – 0.2137*** (0.075) |
|
Short term – ? growth 0.073*** (0.0296) 0.2397*** (0.045) Constant 0.2056*** (0.031) 0.434*** (0.051) |
– 0.0757 (0.090) 0.3808*** (0.093) |
| No. obs. 672 400 | 272 |
| No. groups 16 16 | 16 |

MG model: long-run and short-run estimates for EMU (dep. var., term spread)
Note: EC – the speed of adjustment coefficient, * p<0.10, ** p<0.05, *** p<0.013.2. A test of the Patrick’s stage of development
23 Empirical literature highlights the linear or the nonlinear nature of the finance-growth relationship. A large number of papers such as King and Levine [1993a, 1993b], Levine, Loayza and Beck [2000], Loayza and Ranciere [2006] show the existence of a linear strong positive relation between financial development and economic growth and that financial development is a good predictor of future economic growth. Recent studies (i.e., Rioja and Valev [2004], Deidda and Fattouh [2002]) find evidence in favor of a nonlinear linkage between finance and growth by means of an exogenous/ endogenous threshold. When pooling countries together in cross-sections, Rioja and Valev [2004] show that the link between finance and growth depends on the stage of economic development: highly and low developed countries have a weak link, whilst in developing economies finance exerts a stronger impact on growth. Kettenni et alli. [2007] nuance this finding. Using parametric and non-parametric specifications, they show that the finance-growth relationship is linear only when the nonlinearity between initial per capita income, human capital and economic growth is taken into account. The pooled mean group estimator proposed in our study tackles the controversial issue of country-specific effects (via short-run coefficients) and allows to disentangle the long-term and short-term effects of the term spread on GDP growth (and vice-versa).
24 As robustness checks, we have estimated various panel dynamic specifications by including in the sample the emerging economies (Emerging Europe) to ensure the results are not influenced by different sample coverage. By doing so, we also propose to test the assumption pointed out by Rioja and Valev [2004] which argue (in the same line with Patrick [1966], Berthélemy and Varoudakis [1998]) that the link between finance and growth depends on the stage of the economic development.
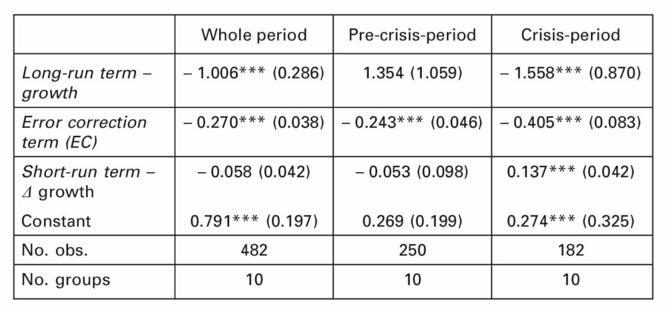
25 The results of some specifications are presented in the tables from 7 to 10. Tables 7 and 8 show findings based on the PMG estimator while the tables 9 and 10 report results obtained by applying the MG estimator for all three periods. As in the previous section, the tests of difference in models, the Hausman test, favor the PMG models. Estimation results reported in these tables suggest that findings of the previous section remain qualitatively unchanged on the entire period when the growth rate is considered as the independent variable. But, results appear qualitatively different in the case where the term spread is the explicative variable. The estimated long-run term spread coefficient is negative and statistically significant (at 1 % and 5 % level) for all three considered samples in both models. Overall, results are rather in line with those obtained by Berthélemy and Varoudakis [1998] showing that finance (via bond market) does not automatically increase growth rates.
PMG model: long-run and short-run results – non-EMU (dep. var., term spread)
| Whole period | Pre-crisis-period | Crisis-period | |
|
Long-run term – growth | – 1.320*** (0.120) | 0.238 (0.171) | – 1.130*** (0.143) |
| Error correction term (EC) | – 0.204*** (0.031) | – 0.228*** (0.045) | – 0.306*** (0.073) |

| Whole period | Pre-crisis-period | Crisis-period | |
|
Short-run term – ? growth | 0.075*** (0.031) | – 0.029 (0.069) | 0.151*** (0.056) |
| Constant | 0.694*** (0.153) | 0.310* (0.175) | 1.135*** (0.320) |
| No. obs. | 482 | 250 | 182 |
| No. groups | 10 | 10 | 10 |

PMG model: long-run and short-run results – non-EMU (dep. var., term spread)
Note: EC – the speed of adjustment coefficient, * p<0.10, ** p<0.05, *** p<0.01PMG model: long-run and short-run results for non-EMU (dep. var., growth)
| Whole period | Pre-crisis-period | Crisis-period | |
|
Long-run term – term spread | – 0.462*** (0.046) | – 0.130*** (0.031) | – 0.387*** (0.071) |
| Error correction term (EC) | – 0.690*** (0.091) | – 0.947*** (0.068) | – 0.832*** (0.087) |
|
Short-run term – ? term spread | – 0.155 (0.169) | 0.153** (0.068) | – 0.123 (0.205) |
| Constant | 1.256*** (0.223) | 1.534*** (0.158) | 0.870*** (0.188) |
| No. obs. | 482 | 250 | 182 |
| No. groups | 10 | 10 | 10 |

PMG model: long-run and short-run results for non-EMU (dep. var., growth)
Note: EC – the speed of adjustment coefficient, * p<0.10, ** p<0.05, *** p<0.01MG model: long-run and short-run results for non-EMU (dep. var., growth)
| Whole period | Pre-crisis-period | Crisis-period | |
|
Long-run term – term spread | – 0.446*** (0.051) | – 0.155** (0.077) | – 0.452*** (0.076) |
| Error correction term (EC) | – 0.709*** (0.089) | – 0.987*** (0.053) | – 0.877*** (0.087) |
|
Short-run term – ? term spread | – 0.152 (0.168) | 0.147*** (0.058) | – 0.086 (0.214) |
| Constant | 1.365*** (0.275) | 1.551*** (0.188) | 1.217*** (0.334) |
| No. obs. | 482 | 250 | 182 |
| No. groups | 10 | 10 | 10 |

MG model: long-run and short-run results for non-EMU (dep. var., growth)
Note: EC – the speed of adjustment coefficient, * p<0.10, ** p<0.05, *** p<0.01| Whole period | Pre-crisis-period | Crisis-period | |
| Long-run term – growth | – 1.006*** (0.286) | 1.354 (1.059) | – 1.558*** (0.870) |
| Error correction term (EC) | – 0.270*** (0.038) | – 0.243*** (0.046) | – 0.405*** (0.083) |
|
Short-run term – ? growth | – 0.058 (0.042) | – 0.053 (0.098) | 0.137*** (0.042) |
| Constant | 0.791*** (0.197) | 0.269 (0.199) | 0.274*** (0.325) |
| No. obs. | 482 | 250 | 182 |
| No. groups | 10 | 10 | 10 |
4. Conclusion and policy implications
26 This paper aims to identify the causal linkages between government bond markets and economic growth for 16 EMU’s countries and 10 non-EMU’s emerging countries over the 2002-2012 period. Our data suggest the use of a pooled mean group estimator. Findings show that in (i) the long-run, the slope of the yield curve negatively influence the growth in real GDP in Emerging Europe but positively in the case of euro area countries and (ii) that economic growth negatively impact the term spreads in all EU countries of the panel. Put differently, findings provide evidence in favor of a positive long-run causality from finance to economic growth for euro area members (validating the supply leading view) but a negative long-run causality for Emerging Europe. According to our results, the long-run causality from economic growth to finance (via bond market) is accepted for all selected European countries. Overall, the results validate a feed-back effect between bond market and economic growth. However, the causal link from finance to growth seems to be stronger than from growth to finance in all countries of the panel. Furthermore, the causality from finance to economic growth is stronger in countries with middle income (Emerging Europe) that in countries with higher income (euro area countries). The positive impact of economic growth on bond is higher in middle-income countries of Europe only during the whole period and the crisis period as the speed of adjustment coefficients are stronger. In terms of policy implications, the bidirectional long-run causality suggest that economic policy should favor the development of both financial and real sectors and possible interactions between them. Finally, as concerns the short-run effects of term spreads on growth or of growth on spreads, effects are unclear (positive or negative) and not statistically significant for all EU members of our panel (implying no short-run causality).
References
- ARESTIS P. and DEMETRIADES P. [1997], “Financial Development and Economic Spread: Assessing the Evidence”, The Economic Journal, 107, p. 783-799.
- BALTAGI B. H. and KAO C. [2000], “Nonstationary panels, cointegration in panels and dynamic panels: a survey”, in Baltagi, B.H. (eds), Nonstationary panels, panel cointegration, an dynamic panels, advances in econometrics, Vol. 15, p. 7-52.
- BECK T., LEVINE R. and LOAYZA N. [2000], “Finance and the sources of growth”, Journal of Financial Economics, Vol. 58 (1-2), p. 261-300.
- BERNANKE B. [1990], “On the predictive power of interest rates and interest rate spreads”, NBER Working Papers, 3486, National Bureau of Economic Research, Inc.
- BERTHELEMY J. C. and VAROUDAKIS A. [1997], “Financial Development and Spread Convergence: A Panel Data Approach”, in Hausmann, R.H., Reisen (eds)., Promoting Savings in Latin America, p. 35-69, Paris: OECD.
- BERNANKE B. S. [1990], “On the Predictive Power of Interest Rates and Interest Rate Spreads”, Federal Reserve Bank of Boston, New England Economic Review, p. 51-68.
- GRUIC B. and WOODRIDGE P. [2012], “Enhancements to the BIS debt securities statistics”, BIS Quarterly Review, December.
- COASE R. [1956], “The Problem of Social Cost”, Journal of Law and Economics, Vol. 3, p. 1-44.
- DAVIS E. P. and FAGAN G. [1997], “Are financial spreads useful indicators of future inflation and output spread in E.U. countries”, Journal of applied econometrics, Vol. 12, p. 701-714.
- DEIDDA L. and FATTOUH B. [2002], “Non-linearity between finance and growth”, Economics Letters, Vol. 74, p. 339-345.
- DICKEY D. A., FULLER W. A. [1979], “Distribution of the Estimators for Autoregressive Time Series with a Unit root”, Journal of the American Statistical Association, Vol. 74, p. 427-431.
- DEMETRIADES P. O. and HUSSEIN K. A. [1996], “Does financial development cause economic growth? Time-series evidence from 16 countries”, Journal of Development Economics, Vol. 51 (2), p. 387-411.
- ESTRELLA A., RODRIGUES A. P. and SCHICH S. [2003], “How Stable Is the Predictive Power of the Yield Curve? Evidence from Germany and the United States”, The Review of Economics and Statistics, Vol. 85, p. 629-644.
- ESTRELLA A. [2005], “Why Does the Yield Curve Predict Output and Inflation?”, The Economic Journal, Vol. 115, p. 722-744.
- FINK G. and FENZ G. [2002], “Did the successful emergence of the Euro as an international currency trigger its depreciation against the US dollar?”, in El-Agraa, A., The Euro and Britain. Implications of moving into the EMU, Financial Times, Prentice Hall, Part II, p. 191-225.
- GOLDSMITH R.W. [1969], Financial Structure and Development, Yale University Press.
- GUPTA K. L. [1984], Finance and Economic Growth in Developing Countries. London: Croom Helm.
- HARVEY C. R. [1989], “Forecasts of economic spread from the bond and stock markets”, Financial analysis journal, September/October, p. 38-45.
- HARVEY C. R. [1991], “Interest Rate Based Forecasts of German Economic Spread”, Review of World Economics, Weltwirtschaftliches Archiv, Zeitschrift des Instituts für Weltwirtschaft Kiel, Band 127, Heft 4, p. 701-718.
- HAUSMAN J. A. [1978], “Specification Tests in Econometrics”, Econometrica, Vol. 46 (6), p. 1251–1271.
- IM K. S., PESARAN M. H. and SHIN Y. [2003], “Testing for Unit Roots in Heterogeneous Panels”, Journal of Econometrics, Vol. 115 (1), p. 53-74.
- KIM Y. H. and RAJAPAKSE P. [2000], “Mobilizing and managing foreign private capital in Asian developing economies”, Asia-Pacific Development Journal, Vol. 81, p. 101 – 121.
- KETTENI E., MAMUNEAS T., SAVVIDES A. and STENGOS T. [2007], “Is the Financial Development and Economic Growth Relationship Nonlinear?”, Economics Bulletin, Vol. 15 (14), p. 1-12.
- KING R. G. and LEVINE R. [1993a], “Finance and Growth: Schumpeter might be right”, Quarterly Journal of Economics, Vol. 108 (3), p. 717-38.
- KING R. G. and LEVINE R. [1993b], “Finance, entrepreneurship and growth: theory and evidence”, Journal of Monetary Economics, Vol. 32, p. 513-542.
- LEVINE A. and LIN C. F. [1992], “Unit root tests in panel data: asymptotic and finite sample properties”, Department of Economics, University of California at San Diego, Discussion paper, No. 92-93.
- LEVINE R., LOAYZA N. and BECK T. [2000], “Financial intermediation and growth: Causality and causes”, Journal of Monetary Economics, Vol. 46, p. 31-77.
- LOAYZA N. and RANCIERE R. [2006], “Financial development, financial fragility and growth”. Journal of Money, Credit and Banking, Blackwell Publishing, Vol. 38 (4), p. 1051-1076.
- LUCAS R. E. [1988], “On the mechanics of economic development”, Journal of Monetary Economics, Vol. 22 (1), p. 3-42.
- MADDALA G. S. and WU S. [1999], “A Comparative Study of Unit Root Tests with Panel Data and a New Simple Test”, Oxford Bulletin of Economics and Statistics, Vol. 61, p. 631-652.
- MCKINNON R. I. [1973], Money and Capital in Economic Development, Washington D.C., The Brookings Institution.
- KOCENDA E., MAUREL M. and SCHNABL G. [2013], “Short-and Long-term Growth Effects of Exchange Rate Adjustment”, Review of International Economics, Vol. 21 (1), p. 137–150.
- PATRICK H. T. [1966], “Financial development and economic growth in underdeveloped countries”, Economic development and Cultural Change, Vol. 14, p. 174- 189.
- PESARAN M. H. [2003], A simple Panel Unit root Test in the presence of Cross Section Dependance, Cambridge Working Papers in Economics, No. 0346, Faculty of Economics, University of Cambridge.
- PESARAN M.H. [1999], “Pooled mean group estimation of dynamic heterogeneous panels”, Journal of the American Statistical Association, Vol. 94, p. 621-634.
- PESARAN M.H., SHIN Y. and SMITH R.P. [1997], Estimating long-run relationship in dynamic heterogenous panels, DAE Working Papers Amalgamated Series 9721.
- PESARAN M.H. and SMITH R.P. [1995], “Estimating long-run relationship in dynamic heterogeneous panels”, Journal of Econometrics, Vol. 68, p. 79-113.
- RIOJA F. and VALEV N. [2004], “Does one size fit all?: a reexamination of the finance and growth relationship”, Journal of Development Economics, Vol. 74 (2), p. 429–447.
- ROBINSON J. [1952], The generalization of the general theory, in The Rate of Interest and Other Essays, London: Macmillan, p. 69-142.
- SCHUMPETER J. A. [1934], The Theory of Economic Development, Harvard University Press.
- SHAW E. S. [1973], Financial Deepening in Economic Development, Oxford University Press.
- STOCK J. H. and WATSON M. W. [2002], “Has the business cycle changed and why?” In Gertler, M., Rogoff, K. (eds.), NBER Macroeconomics Annual 2002.
Publisher keywords: bond markets, economic growth, panel vector error correction
Uploaded: 11/26/2014
https://doi.org/10.3917/redp.244.0571