Journal issue

Varia

Revue économique
2016/1 Vol. 67


176 pages

Table 1
Table 1

Main characteristics of the sample*

* These numbers were obtained from the information on the webpages of monasteries in August 2013; for links to these webpages see: http://www.benediktiner.de/index.php/abteien-und-kloester-in-deutschland.html

Table 2
Table 2

Geographical representativeness of the sample*,**

* These numbers were obtained from the information on the webpages of monasteries in August 2013; for links to these webpages see: http://www.benediktiner.de/index.php/abteien-und-kloester-in-deutschland.html

Table 3
Table 3

Average subjective responses of the respondents to relevant monastery-related items

Table 4
Table 4

Comparison of the averages for two soep samples with our sample**,**,***

* The data used in this publication were made available to us by the German Socio-Economic Panel Study (soep) at the German Institute for Economic Research (diw), Berlin.

Figure 1
Figure 1

Life satisfaction vs. age: Comparison of our sample with women in soep dataset4

Figure 2
Figure 2

Life satisfaction vs. age: Comparison of religious and non-religious women in soep with Benedictine nuns

Table 5
Table 5

Average life satisfaction in two age groups of Benedictine nuns, married women and unmarried women in soep

Figure 3
Figure 3

Life satisfaction vs. age: Comparison of married and unmarried women in soep

Table 6
Table 6

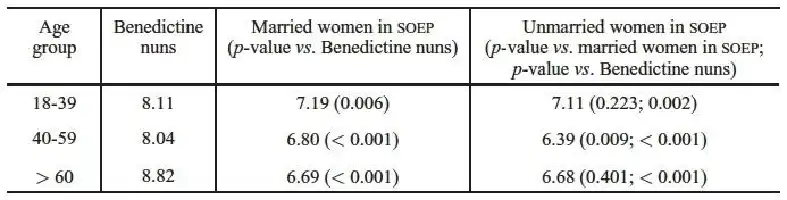
Average life satisfaction in three age groups of Benedictine nuns, married women and unmarried women in soep

Figure 4
Figure 4

Life satisfaction vs. age: Comparison of women with and without children in soep

Table 7
Table 7

Average life satisfaction in three age groups between Benedictine nuns, women with children and women without children in soep

Figure 5
Figure 5

Health vs. age: Comparison of our sample with women in soep

Figure 6
Figure 6

Satisfaction with health vs. age: Comparison of our sample with women in soep

Figure 7
Figure 7

Satisfaction with work vs. age: Comparison of our sample with women in soep

Table 8
Table 8

Ordered logistic estimation for Benedictine nuns: Odds ratios

Table 9
Table 9

Ordered logistic estimation for soep women: Odds ratios

Table 10
Table 10

Ordered logistic estimation: Odds ratios

Table 1
Table 1

Descriptive statistics

Table 2
Table 2

Gain statistics test

(a) : x and z0 are is gdp per capita and energy use per capita, respectively.

Figure 1
Figure 1

Structural nonparametric estimations

The solid line represents the nonparametric fit. The dashed lines correspond to the 95% pointwise confidence interval.