Cite this issue

Annual rates of natural increase, 2001-2012, European Union (per 1,000)
Coverage : European Union (28 countries).
Source : Eurostat (site consulted in July 2014).

Annual rates of net migration, 2001-2012, European Union (per 1,000)
Coverage : European Union (28 countries).
Source : Eurostat (site consulted in July 2014).

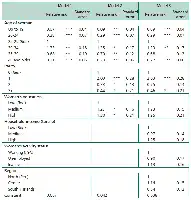
Population pyramids in 1914, 1954, and 2014
1 Shortfall of births due to the war of 1870
Source : Pison, 2014.

Number of first permits of one year or more granted to nationals of third countries (constant geographical area) by first year of validity and period of validity
Coverage : Permits granted in France and abroad to nationals of countries not listed in Footnote 5. Permits granted in year n and recorded in the data extracted in July of the year n + 2, except for 2009, when extraction took place in July 2012.
Source : Authors’ calculations based on AGDREF data.

Distribution of permits granted in 2012 by age and sex
Source : Authors’ calculations based on AGDREF data.

Distribution of holders of a first residence permit of one year or more by age group and first year of validity (%)
Coverage : Permits granted to foreigners. See Table 1.
Source : Authors’ calculations based on AGDREF data.

Distribution of adult holders of a first residence permit of one year or more by sex and first year of validity (%)
Coverage : Permits granted to foreigners. See Table 1.
Source : Authors’ calculations based on AGDREF data.

Distribution of holders of a first residence permit of one year or more by continent of origin and first year of validity (%)
Coverage : Permits granted to foreigners by nationality of origin. Turkey is included in Asia. Europe includes all countries not listed in Footnote 5. The total does not necessarily sum to 100 due to rounding and missing values.
Source : Authors’ calculations based on AGDREF data.

Distribution of holders of a first residence permit of one year or more by reason for admission and first year of validity (%)
Coverage : permits granted to foreigners, by reason for admission listed in AGDREF.
Source : Authors’ calculations based on AGDREF data.

Fertility by age group since 2008 (per 1,000 women)*,(a)
* due to rounding, the total may differ slightly from the sum, and the variations may not correspond to apparent differences.
Source : Authors’ calculations based on birth records, adjusted according to the size of the female population at each age.

Age-specific fertility rates in 1960, 1970, 1980, 1990, 2000, 2010, and 2013 (per 1,000 women)
Coverage : Metropolitan France.
Source : Authors’ calculations based on birth records, adjusted according to the size of the female population at each age.


Number of marriages and civil partnerships (close-up on 1999-2013)
Coverage : Metropolitan France.

Age-specific probability of first marriage, women and men, 1972-2012 (per 10,000)
Coverage : Metropolitan France.
Source : INSEE.

Number of PACS since 2009*
* Provisional
Source : Ministry of Justice (unions registered in magistrates’ courts and through notaries).


Divorce by marriage duration and cohort
Coverage : Metropolitan France.
Source : Ministry of Justice.


Life expectancy at birth (both sexes combined) and difference between male and female life expectancies at birth, 1990-2013
Source : INSEE.

Ratios between the three-year life table of 2010-2012 and that of 1990-1992 for age-specific probabilities of dying (smoothed over 3 years of age), by sex
Source : INSEE, Situation démographique 2012, Table 68.

Contributions by age group to gains in male and female life expectancy at birth between 1990-1992 and 2010-2012 (5.3 and 3.7 years in total)
Source : Authors’ calculations on the basis of INSEE’s three-year life tables by sex.

Contribution of age groups and causes of death to gains in life expectancy at birth (in years) between 1989-1991 and 2009-2011, by sex
Note : The method used to calculate the contribution of each age group and cause to gains in life expectancy at birth between two periods is the one proposed by Andreev, Shkolnikov and Begun (2002).
Source : Authors’ calculations on the basis of INSEE life tables by sex and INSERM data on deaths by cause (CépiDc).

Standardized mortality rates at ages 45-64 for the most lethal cancers by sex, from 1989-1991 to 2009-2011 (three-calendar-year moving average)
UADT : Upper aerodigestive tract
Sources : Standardized rates calculated by the authors on the basis of age-specific mortality rates from the INSEE life tables and deaths by cause provided by INSERM (CépiDc).

Population change (in thousands) and crude rates (per 1,000)1,*
1 Population and rates revised after the 2011 census.
Source : INSEE, Demographic Surveys and Studies Division, Bellamy and Beaumel (2014).

Age distribution of the population on 1 January (%)*
* Provisional.
Source : INSEE, Demographic Surveys and Studies Division, series revised after the 2011 census.

Number of first residence permits of at least one year granted to citizens of third countries (constant geographical area) by first year of validity
Note : Countries that were European Union members on 30 June 2013 are excluded, along with the Vatican City State, Iceland, Liechtenstein, Norway, the principalities of Andorra and Monaco, the Republic of San Marina and Switzerland.
Source : Authors’ calculations based on AGDREF data.

Fertility since 1970*
na : not available.
Sources : INSEE, Surveys and Demographic Studies Division. Series revised after the 2011 census except : (1) 1970-1995 : Laurent Toulemon, from EHF (Study of Family History) 1999 ; 2000 : estimate based on vital records ; 2004-2010 : Davie and Niel (2012) Table 3.

Cohort fertility : cumulative fertility up to selected ages, estimated completed fertility (mean number of children per 100 women), and mean age at childbearing (in years and tenths of years)*
* For the 1930-62 cohorts, observed completed fertility and mean age at childbearing ; for later cohorts, unobserved rates are assumed equal to rates observed at the same age in 2011.
Source : Calculations and estimates based on data from INSEE, Demographic Surveys and Studies Division.

Total fertility rates in Europe (children per woman)
Source : Eurostat (site accessed in June 2014).

Cohort fertility in Europe(1),(2)
(1) Two estimates are proposed. One is based on rates that remain unchanged with respect to the last observation year, the other on a continuation of the trend at each age over the last 15 observed years.
Sources : Calculations and estimations based on age-specific fertility rates published on the Eurostat website (site accessed 18 July 2013).


Characteristics of nuptiality and divorce since 1985*,(1),(2),(3)
* Provisional.
Sources : INSEE, Division of Demographic Surveys and Studies ; French Ministry of Justice.


Characteristics of overall mortality since 1985*,(1),(2)
* Provisional.
Source : INSEE, Demographic Surveys and Studies Division.

Life expectancy at birth in Europe in 2012*
* Provisional data.
Source : Eurostat (Table 00025, http://epp.eurostat.ec.europa.eu/portal/page/portal/statistics/search_database, accessed 27 May 2014).

Infant mortality in Europe 1980-2012 (rate per 1,000 live births)*,(1)
* Provisional.
Source : Eurostat (Table 00027, http://epp.eurostat.ec.europa.eu/portal/page/portal/statistics/search_database, accessed 27 May 2014), except (1).


Cause-of-death categories and the corresponding codes in the International Classification of Diseases (ninth and tenth revisions)
Number of induced abortions and annual indicators, 1976-2011(1),(2),(3),(4),(6),(7)
Coverage : Metropolitan France.

Abortion rates by age, 1990-2011 (per 1,000 women)
Coverage : Metropolitan France.
Source : Authors’calculations from DREES data and census data.

Characteristics of women having an induced abortion (per 100 induced abortions)
Note : Notification figures include elective and therapeutic abortions.
Source : Abortion notifications, authors’ calculations.

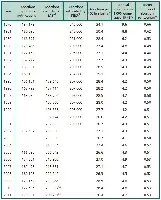
Mean weeks of amenorrhea (WA) at abortion by technique used, 1990-2011(a),(b)
(a) The mean duration of amenorrhea for all abortions was corrected on the basis of the exhaustive figures for surgical and medical abortions by hospital sector (public or private) in the 2002 annual healthcare statistical report (SAE). The proportion of medical abortions is also taken from SAE 2002.
Sources : INED, SAE, DREES and authors’ calculations.
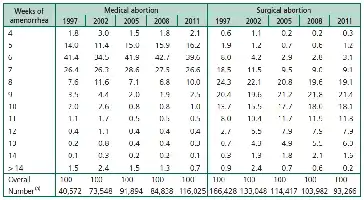
Distribution of induced abortions by weeks of amenorrhea and technique (%), 1997-2011(a)
(a) Numbers are calculated from the proportion of medical abortions on the notification forms and the total number of forms (corrected for under-recording for 1997), and from the proportion of medical abortions and total numbers of abortions recorded in the SAE for 2002 and by DREES for 2005-2011.
Sources : INED, SAE, DREES and authors’ calculations.
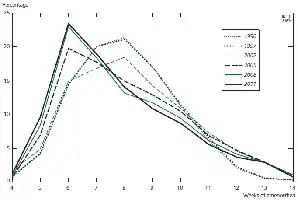
Distribution of abortions by weeks of amenorrhea (WA) (%), 1990-2011
Note : The figures taken from notifications include elective and therapeutic abortions.
Sources : Notification forms and authors’calculations.

Mean weeks of amenorrhea at the time of abortion by women’s sociodemographic characteristics, Metropolitan France, 1990-2011
Note : The figures taken from notifications include elective and therapeutic abortions.
Sources : Notification forms and authors’ calculations.

Proportions of early and late abortions by women’s sociodemographic characteristics, metropolitan France, 1990-2011
Note : The figures taken from notifications include elective and therapeutic abortions.
Sources : Notification forms and authors’ calculations.

Distribution of abortions by number of previous abortions and year (%)
Note : The figures for 1998, 1999, 2000, 2001, 2003, and 2004 have been interpolated. The figures taken from notifications include elective and therapeutic abortions.
Sources : Notification forms and authors’ calculations.

Number of abortions per woman, by order and year
Note : For this graph we have adopted DREES estimates of the mean number of abortions per woman from 1991 on (Vilain, 2014). Based on the INED estimates (Table 1), the increase in repeat abortions is more regular over the period, and the levelling-off of second or higher abortions between 1985 and 1995 is less marked. The figures taken from notifications include elective and therapeutic abortions.
Sources : Notification forms and authors’ calculations.

Abortion rates by number of previous abortions and time since previous abortion (per 1,000)
Note : Incidence rates calculated as the ratio of order r+1 abortions at time t to order r abortions in year (2011 – t). The rate in the first year, at time 0.5 (two abortions in one year) has been doubled in order to be presented as an annual rate. The figures taken from notifications include elective and therapeutic abortions.
Sources : Notification forms and authors’ calculations.

Probability of a further abortion, mean age at abortion and interval between abortions in 2011
Note : Mean age at abortion based on rates by order and age ; interval between abortions based on rates by interval and order.
Sources : Notification forms and authors’calculations.

Probability of having an abortion by number of previous abortions and year (%)
Sources : 1980, 1990, and 2002 : Rossier et al., 2009. The 1980 and 1990 figures were estimated from the abortion cohorts of 1976 and 1985, respectively ; 2011 : model by age and time since previous abortion. Notification forms and authors’ calculations.

Probability of having a further abortion by number of previous abortions in 2011 and age (%)
Note : The “2002” curve shows probability by age of having a first abortion in 2002, given that in that year there was practically no correlation with the number of previous abortions : in 2002 the curves of probability of repeat abortion by number of previous ones virtually coincided (Rossier et al., 2009). The figures taken from notifications include elective and therapeutic abortions.
Sources : Notification forms and authors’ calculations.

Distribution of women by lifetime number of abortions (%)
Note : The figures taken from notifications include elective and therapeutic abortions.
Sources : Notification forms and authors’calculations based on Table 8.


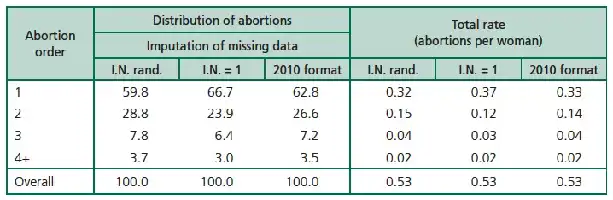
Distribution of abortions by order in 2011 and order-specific total rate by hypothesis regarding incomplete notifications
Note : I.N. rand. : hypothesis of randomly distributed incomplete notifications ; I.N. = 1 : hypothesis whereby all incomplete notifications correspond to first abortions (no previous abortion) ; 2010 format : observed distribution from completed “2010 format” notifications. This is the distribution used in this article.
Sources : Notification forms and authors’calculations.
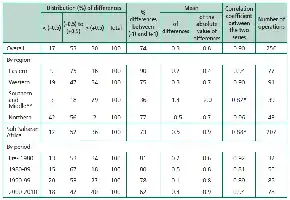
Differences (census estimate – survey estimate) between estimates of median age at marriage calculated from censuses and from surveys, 1950-2010*,**
* The correlation is affected by two outliers from Botswana. When these two surveys are excluded, the correlation coefficient becomes 0.96 for the Southern and Middle region, 0.95 for sub-Saharan Africa and 0.94 for Africa as a whole.
Source : Pan-African database on nuptiality, INED.

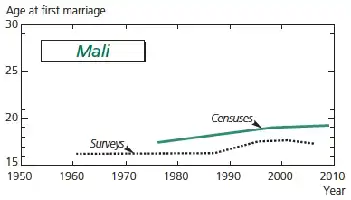
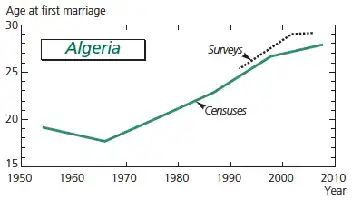
Trends in median age at first marriage : consistency of time series calculated from census data and from survey data
Source : Appendix Table A.1.

Consistent series – strictly defined
The difference between the two estimates never exceeds 0.5 years

Consistent series – broadly defined
No more than 20% of data points with a difference of 0.5-1 year
Series with inconsistencies
Median age (censuses) > Median age (surveys) no more than one data point with a difference in the opposite direction
Series with inconsistencies
Median age (censuses) < Median age (surveys) no more than one data point with a difference in the opposite direction

Series with inconsistencies
Varying differences
Source : Pan-African database on nuptiality, INED.

Comparison of marital status recorded on the individual women’s questionnaire and on the household questionnaire, women aged 15-19 covered by both surveys*
* The proportion of consistent declarations is measured with respect to the total number of women recorded with this marital status by the questionnaire under consideration (household or women’s).
Sources : MICS-2 surveys that recorded marital status on both household and individual questionnaires.
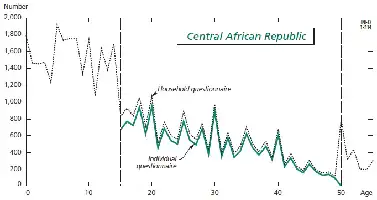
Age distribution of women recorded on the household questionnaire and of women covered by the individual survey, MICS-2 (2000), Central African Republic and Cameroon
Sources : MICS-2 Surveys.

Age distribution of women recorded on the household questionnaire and of women covered by the individual survey, MICS-2 (2000), Central African Republic and Cameroon
Sources : MICS-2 Surveys.

Distortion of the sample of women aged 15-19, sample loss and underestimation of women’s ages(1),(2),(3),(4),(5),(6)
(1) Marital status as reported in the survey of individual women. The indicator is calculated on the basis of all women included in the individual survey.
Sources : MICS-2 Surveys.

Comparison of estimates of median age at first marriage drawn from cross-sectional data : corrected (“probable”) estimate, estimates drawn from the household and individual women’s questionnaires
Note : Countries are listed in ascending order by “probable” median age at first marriage.
Sources : MICS-2 Surveys.


Series with inconsistencies : more than 20% of data points with a difference greater than 0.5 years (31 countries)(1)
Coverage : Countries with at least two available points of comparison for the period 1950-2010.
Source : Pan-African database on nuptiality, INED.

(1) After weighting.
Sources : MICS-2 Surveys. De jure population. Statistical processing by the authors.
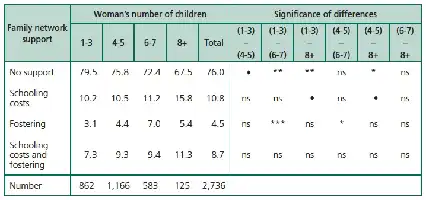
Distribution of women (%) by type of support received for schooling and number of surviving children
Significance levels : *** p < 0.001 ; ** p < 0.01 ; * p < 0.05 ; ? ? p < 0.10 ; ns = non-significant difference at 10% level.
Source : OPO-Demtrend, 2012 ; authors’ calculations.

Women’s sociodemographic characteristics by receipt of family network support for children’s schooling
Source : OPO-Demtrend, 2012 ; authors’ calculations.

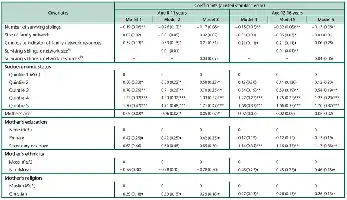
Factors associated with the family network support received by female respondents for the schooling of their children
Note : The number of children was considered as both a continuous variable (Models 1 and 3) and a categorical variable (Models 2 and 4).
Source : OPO-Demtrend, 2012 ; authors’ calculations.

Proportion of children aged 6-16 attending school at the time of the survey by number of surviving siblings
Note : The differences are statistically significant at the 1% level in both age groups.
Source : OPO-Demtrend, 2012 ; authors’ calculations.
Factors associated with school attendance of children aged 6-16(a),(a)
(a) Interaction between number of siblings and family network size (Models 2, 5).
Source : OPO-Demtrend, 2012 ; authors’ calculations.

Factors associated with school attendance of children aged 6-16(a),(a)
(a) Interaction between number of siblings and family network size (Models 2, 5).
Source : OPO-Demtrend, 2012 ; authors’ calculations.

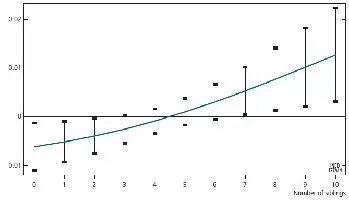
Effect of family network size by number of siblings
Source : OPO-Demtrend, 2012 ; authors’ calculations.
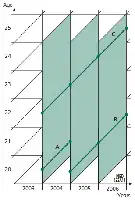
Lexis diagram for the selection of women in the dataset, Italy, 2004-2007
Note : Arrows represent women who are considered only if they have been interviewed at least twice, in any two consecutive years between 2004 and 2007. Filled rectangles represent the interview periods. Note that, while interviews were spaced 12 months apart on average, they were not actually conducted at the beginning of each year. In this paper, however, for the sake of simplicity, fertility is imputed to the year of the interview : it is therefore convenient to imagine that women were interviewed on December 31. All women’s characteristics, including age, are observed and recorded at the beginning of each year, and, when subject to change, they are updated at every new round of the panel (i.e. they are time-varying).
Source : EU-SILC Italy, 2004-2007.

Woman-years, births and fertility, Italy, 2004-2006
Note : Weighted data. All numbers are rounded. Fertility rates are per 1,000 women. Total fertility equals the sum of age-specific fertility rates, taking the width of the age class into account.
Source : EU-SILC Italy, 2004-2007 ; own calculations.

Estimated age-specific fertility rates in Italy, 2004-2006
Note : 25-29 is the reference age group in this paper (Table 2).
Source : EU-SILC Italy, 2004-2007 ; own calculations.
Event history analysis (EHA) regression models for fertility in Italy, 2004-2006
Notes : Model results include missing categories (or non-response). Models are adjusted for intra-group correlations to account for the fact that some women are observed for more than one year. The constant represents the estimated risk for women in the reference group, in births per woman per year.
Source : EU-SILC Italy, 2004-2007 ; own calculations.

Estimates of TFR by various population characteristics, Italy, 2004-2006
Notes : Subgroup TFRs have been forced to average 1.33 (official national average), given the RRs (from Table 2) and the distribution of women. Weighted data.
Source : EU-SILC Italy, 2004-2007 ; own calculations.


Estimates of total fertility in North Korea, various sources and estimation methods, 1979-2009

Estimates of total fertility, various sources and estimation methods, North Korea
Sources : 1993 Census : Author’s calculations based on DPRK Central Bureau of Statistics (1995) ; 2008 Census : Author’s calculations based on DPRK Central Bureau of Statistics (2009) ; 2009 MICS : Author’s calculations based on DPRK Central Bureau of Statistics and UNICEF (2010).

Estimates of total fertility, various sources and estimation methods, North Korea
Sources : 1997 RHS : DPRK Population Center (1998) ; 2002 RHS : Author’s calculations based on DPRK Central Bureau of Statistics (n.d.) ; 2004 RHS : Author’s calculations based on DPRK Central Bureau of Statistics (2004) ; Vital Registration : DPRK Central Bureau of Statistics and UNICEF (n.d. and 2004).