Cite this issue

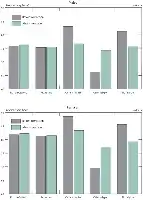
Age-sex structure by religious affiliation, Switzerland, 2000
Sources: Federal population censuses, Federal Statistical Office.

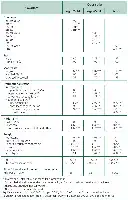
Logistic regression of the risk of religious mobility between the census and death by characteristics reported in the 1990 census, matched deaths 1991-2000
Life expectancy at birth by religious affiliation, before and after correction for religious mobility, Switzerland, 1991-2004
Sources: Population censuses of 1990 and 2000, vital records, 1991-2004.

Level and structure of mortality by religious affiliation, after correction of information given at time of death, Switzerland, 1991-2004

Probabilities of dying from a specific cause for different age groups (taken from a multiple decrement table), population living in Switzerland, 1991-2004
Sources: Population censuses of 1990 and 2000, vital records, 1991-2004.

Logistic regression of the risk of dying by selected cause of death in Switzerland, population aged 25-44 (odds ratio)

Logistic regression of the risk of dying by selected cause of death in Switzerland, population aged 45-64 (odds ratio)

Logistic regression of the risk of dying by selected cause of death in Switzerland, population aged 65+ (odds ratio)


Separation rate by birth cohort in France (hazard function estimated by Kaplan Meier model)
Source: “Étude de l’histoire familiale” survey, INSEE-INED, 1999.

Proportions of men and women by age, presence of children, and age of children at time of first separation (%)


Distribution of propensity scores for separated and non-separated persons
Source: Authors’ calculations from 1997 “Jeunes et carrières” and 2005 “Familles et employeurs” surveys.

Distribution (%) of separated women by labour market status before and after break-up, compared with non-separated women (Kernel matching)
Source: Authors’ calculations from 1997 “Jeunes et carrières” and 2005 “Familles et employeurs” surveys.

Distribution (%) of separated men by labour market status before and after separation, compared with non-separated men (Kernel matching)
Source: Authors’ calculations from 1997 “Jeunes et carrières” and 2005 “Familles et employeurs” surveys.


Change in women’s labour market status around the time of separation (percentage) (Kernel matching)

Change in men’s labour market status around the time of separation (percentage) (Kernel matching)

Probability of (re)entering the labour market for women who where inactive before separation (logit model)

Retrospective calendar covered by each survey. Lexis diagram
Source: 1997 “Jeunes et carrières” and 2005 “Familles et employeurs” surveys.


Period parity progression ratios, India, 1977-2004
Source: Author’s calculations based on the three NFHS surveys.

Mean birth intervals, India, 1977-2004
Source: Author’s calculations based on the three NFHS surveys.

Implied period completed parity distribution and average lifetime parity, India, 1977-2004, selected years

Lifetime average parity for synthetic cohorts (three-year moving average) and total fertility estimates
Sources: Average parity: author’s calculations based on the three NFHS surveys; TF (SRS): Visaria, 2004, p. 58 and http://censusindia.gov.in/vital_statistics/Vital_Rates/Vital_rates.aspx (accessed 22 July 2009); NFHS-1, NFHS-2, NFHS-3: IIPS and Macro International 2007, p. 78.

Decomposition of the 1977-2004 fertility decline in India by progression to each successive birth
Source: Author’s calculations based on the three NFHS surveys.

Period parity progressions ratios (PPPRs), mean birth intervals (), and synthetic lifetime average parity, India, 1977-1991

Period parity progressions ratios (PPPRs), mean birth intervals (), and synthetic lifetime average parity, India, 1977-1991

Period parity progressions ratios (PPPRs), mean birth intervals (), and synthetic lifetime average parity, India, 1983-1997

Period parity progressions ratios (PPPRs), mean birth intervals (), and synthetic lifetime average parity, India, 1983-1997

Period parity progressions ratios (PPPRs), mean birth intervals (), and synthetic lifetime average parity, India, 1990-2004

Period parity progressions ratios (PPPRs), mean birth intervals (), and synthetic lifetime average parity, India, 1990-2004


