Cite this issue


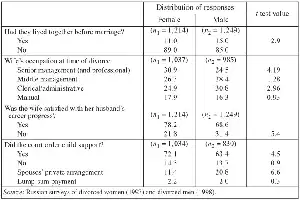
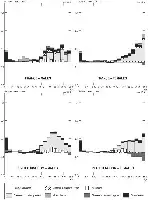
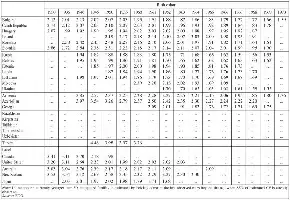
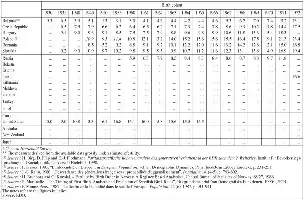
Selective effect of migration (samples limited to the last twelve years of divorce). Percentage distribution of responses

Persistent differences on “dual” information (samples limited to the last twelve years of divorce). Percentage distribution of responses

Answers with large proportions of “don’t know” (samples limited to the last twelve years of divorce). Percentage distribution of responses


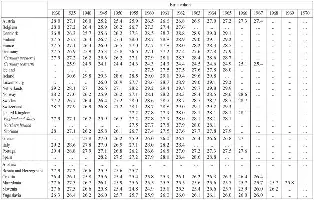
Determinants of migration between 1982 and 1990 by age groups and communes of residence. Logit model coefficients
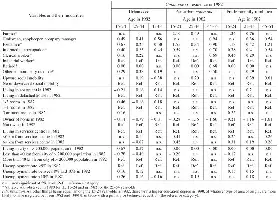
Determinants of migration between 1982 and 1990 by age groups and communes of residence. Logit model coefficients

Determinants of migration between 1982 and 1990. Interaction terms between occupational categories and educational level in the logit models
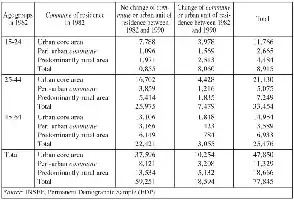
Distribution of the population by modality of the dependent variable, age in 1982 and category of the commune of residence in 1982

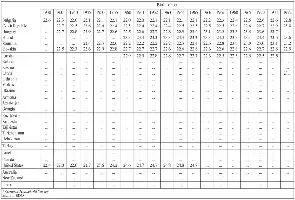
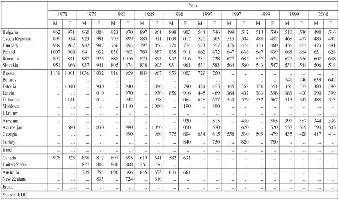
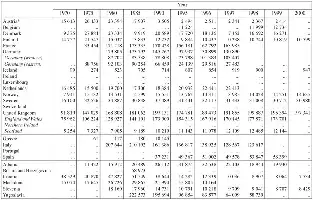
Immigrants admitted to Quebec between 1945 and 1997
Source: CIC (Ministry of Citizenship and Immigration of Canada).

Ten principal countries of birth, immigrants aged 18 and over, 1989, Montreal Metropolitan Census Region (percentage distribution)
Source: CIC (Ministry of Citizenship and Immigration of Canada).

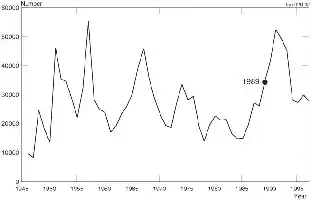
Unemployment rate in the Montreal Metropolitan Census Region, 1980-1992
Source: Statistics Canada, Labour force statistics, 1992.


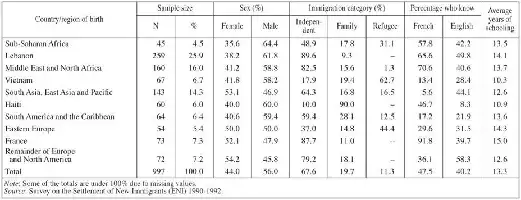
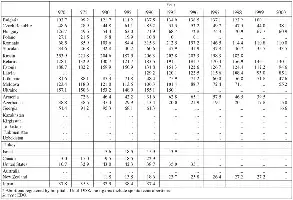
Sample size and characteristics of respondents to the ENI survey according to country/region of birth
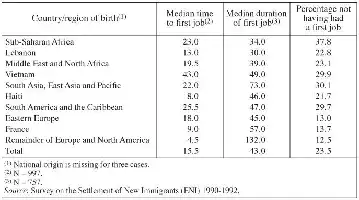
Median time of entry to, and duration of, first employment (in weeks) and proportion of those surveyed not having had a first job as of the time of survey, according to the country or region of birth
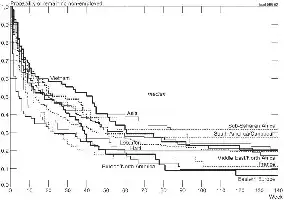
Probability of not landing a first job (Kaplan-Meier survival curves), by national origin
Source: Survey on the Settlement of New Immigrants (ENI) 1990-1992, rounds 1 to 3.


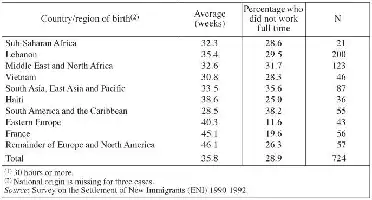
Average number of weeks of full-time work(1) during the first 78 weeks in Montreal, and percentage of respondents who did not work at least one week full time during this period, by country or region of birth

Tobit regression coefficients associated with the number of weeks worked full time during the first 78 weeks in Montreal


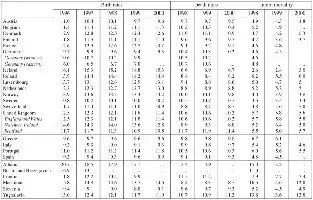


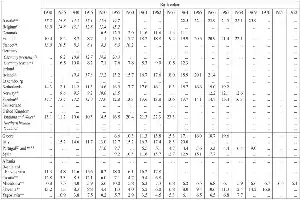


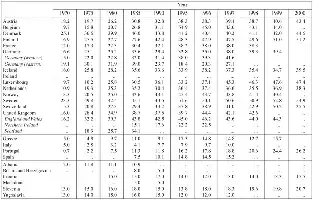


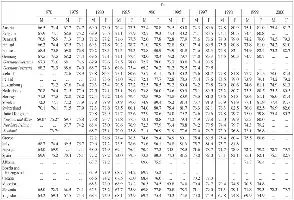
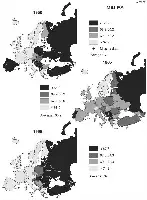
Map of life of all expectancies in Europe, in 1950 and 1965 and 1995, by sex (in years)
Source: Vallin and Meslé, 2001.

Map of life of all expectancies in Europe, in 1950 and 1965 and 1995, by sex (in years)
Source: Vallin and Meslé, 2001.

Annual trend in life expectancy at birth in Sweden, Italy, Poland and Russia, since World War II (in years)
Sources: Andreev et al. (1998) and Meslé et al. (1996) for Russia; national statistical yearbooks for the other countries.

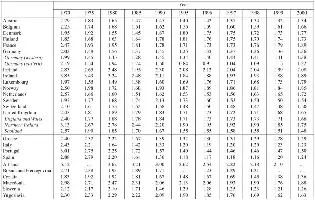
Life expectancy in 1995 compared to life expectancy in 1965 (in years)
Source: Vallin and Meslé, 2001.
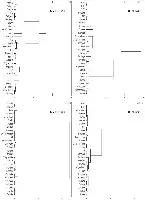
Dendrograms resulting from the hierarchical analysis of age-specific probabilities of dying in 28 European countries, in 1965 and 1995, by sex
Source: Life tables published by national statistics institutes or computed by the authors.

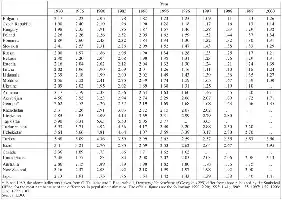
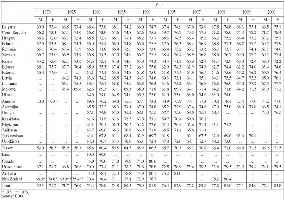
Age-specific death probabilities by 5-year group for the four groups of countries resulting from the male dendrogram, in 1965 and 1995, by sex
Source: Life tables computed by the authors on the basis of national data.

Ratio of 1965 probability of dying to that of 1995 for the four groups of countries resulting from the male dendrogram, by sex
Source: Mortality tables calculated by the authors on the basis of national data.

Ratio of probabilities of dying for the four groups of countries to the average probabilities of dying for all of Europe, in 1965 and 1995, by sex
Source: Life tables computed by the authors on the basis of national data.

Contribution of changes in age-specific mortality to the gains and losses in life expectancy between 1965 and 1995 for the four groups of European countries (in years)
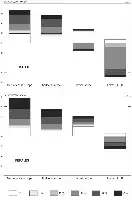
Contribution of age-specific mortality changes to the gains and losses in life expectancy between 1965 and 1995, for the four groups of European countries (in years)
Source: Life tables computed by the authors on the basis of national data.

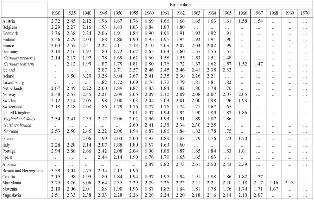
Standardized mortality rates since 1950 for 5 large groups of causes of death in the United Kingdom, France, Poland, Russia, both sexes*
Source: Vallin and Meslé, 2001.

Standardized rates of mortality from lung cancer since 1965 in the United Kingdom, France, Poland, and Russia, by sex
Sources: WHO database for Poland and the United Kingdom; Vallin-Meslé database for France; Meslé et al. (1996) for Russia.

Standardized rates of mortality from four types of cardiovascular diseases since 1965 in the United Kingdom, France, Poland and Russia, both sexes
Sources: WHO database for Poland and the United Kingdom; Vallin-Meslé database for France; Meslé et al. (1996) for Russia.

Standardized rates of mortality from heart diseases and cerebrovascular diseases and other diseases of the circulatory system since 1965 in the United Kingdom, France, Poland, and Russia, for both sexes
Sources: WHO database for Poland and the United Kingdom; Vallin-Meslé database for France; Meslé et al. (1996) for Russia.

Standardized rates of mortality from homicide since 1965 in the United Kingdom, France, Poland and Russia, males
Sources: WHO database for Poland and the United Kingdom; Vallin-Meslé database for France; Meslé et al. (1996) for Russia.
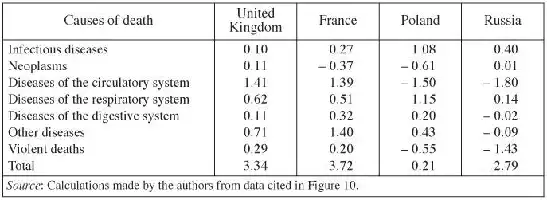
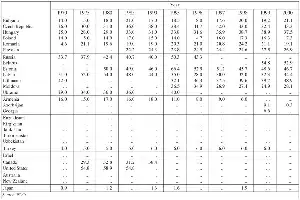
Contribution of changes in large groups of causes of death to the gains and losses in male life expectancy between 1965 and 1984 in the United Kingdom, France, Poland and Russia (in years)

Contribution of changes in large groups of causes of death to the gains and losses in male life expectancy between 1965 and 1984 in the United Kingdom, France, Poland and Russia (in years)
Source: Calculations made by the authors from data cited in Figure 10.
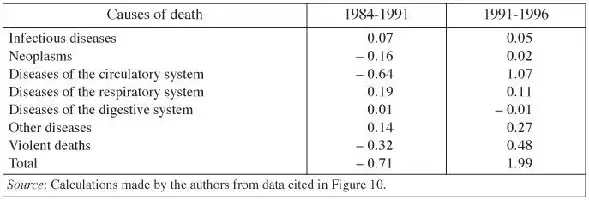
Contribution of changes in large groups of causes of death to the gains and losses in male life expectancy between 1984 and 1991 and between 1991 and 1996 in Poland (in years)

Contribution of changes in large groups of causes of death to the gains and losses in male life expectancy between 1984 and 1991 and between 1991 and 1996 in Poland (in years)
Source: Calculations made by the authors from data cited in Figure 10.
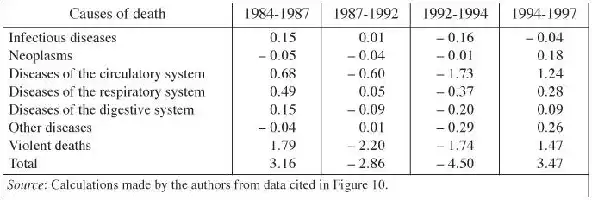
Contribution of changes in large groups of causes of death to the fluctuations of male life expectancy in Russia since 1984 (in years)
Contribution of changes in mortality by age and large groups of causes of death to the fluctuations of male life expectancy in Russia since 1984 (in years)
Source: Calculations made by the authors from data cited in Figure 10.