Shape characteristics of useful field of view and visual search time
- Par Alan Hoi Shou Chan
- et D. K. T. So
Pages 343 à 367
Citer cet article
- CHAN, Alan Hoi Shou
- et SO, D. K. T.,
- Chan, Alan Hoi Shou.
- et al.
- Chan, A.-H.-S.
- et So, D.-K.-T.
https://doi.org/10.3917/th.704.0343
Citer cet article
- Chan, A.-H.-S.
- et So, D.-K.-T.
- Chan, Alan Hoi Shou.
- et al.
- CHAN, Alan Hoi Shou
- et SO, D. K. T.,
https://doi.org/10.3917/th.704.0343
I. INTRODUCTION
1Visual search has long been a topic for human factors studies in industry and is an important part of many human activities. Despite advances in computer vision, visual search is still a topic of interest in industrial inspection, where target items to be detected are embedded in a background of non-targets (Drury & Prabhu, 1994). Recent studies of visual search have included exploration of search strategies and human error in aircraft inspection (Drury, 1993; Drury & Wenner, 2000), microchip inspection in electronic industries (Chi & Drury, 1998), design of virtual workspace environments (Stark, Yamashita, Tharp, & Ngo, 1993) and visual displays (Kee, Jung, & Chung, 1992; Jung, Shin, & Kee, 2000). When a person fixates a point, photopic visual sensitivity is at a maximum along the line of sight and decreases approximately linearly into the periphery, and in the far periphery it falls off rapidly. The useful field of view (UFOV) defines the limit of peripheral sensitivity for particular target and background characteristics. It represents the probability of target acquisition as a function of eccentricity from fixation, and is the area within which the stimulus must be recognized, categorized, or identified. UFOV has been shown to be a function of target and stimulus (Sanders, 1970; Brown, 1979), for example, size and color (Abramov & Gordon, 1977; Gordon & Ahramov, 1977), contrast (Engel, 1971), movement (Barbur, 1979), background luminance (Engel, 1974).
2Good correlations between various measures of UFOV and search performance have been found (Leachtenauer, 1978; Courtney & Chan, 1986), and field area is an important parameter in mathematical modelling of visual search (Kraiss & Knaeuper, 1982; Courtney & Guan, 1998; Hong & Drury, 2002). In mathematical models, the UFOV is usually assumed to be round and symmetrical, and since full field mapping requires a lot of data, estimates of field size rather than shape have generally been used. Useful fields of view have been described as ovaloid and horizontally elongated, and sufficiently regular and symmetrical to be approximated from a few target exposures on a limited number of meridians. However, marked irregularities in field boundary contours have been found (e.g., Chaikin, Corbin, & Volkman, 1962; Engel, 1971; Courtney & Chan, 1993) indicating that UFOV shape may be important for performance prediction using mathematical models. Extensive tests of UFOV size and shape (Engel, 1971; Ikeda & Takeuchi, 1975; Courtney & Chan, 1985a, 1985c, 1993) found irregular boundaries not much like circles or ellipses. Using sixteen meridians, Courtney and Chan (1985a, 1985b) found irregular binocular areas, patches of apparent insensitivity within the area, and large differences between subjects. When testing search strategies with complete and incomplete fields, Courtney and Guan (1996) found a large percentage increase of search time with the incomplete fields, and strong interactions between field shapes and search strategies. Such findings question the validity of mathematical search models using regular, homogeneous UFOV for performance prediction. For example, early models predicted that search would take twice as long with a random strategy than with a systematic strategy. However, if the UFOV area is not regular and homogeneous, then even a perfect systematic scanning strategy may not completely cover a display and there is no reason to expect a systematic strategy to be better than a random strategy. Indeed, if areas are refixated too systematically, a random strategy may be more effective. Also, lack of awareness of UFOV characteristics means that even with good knowledge of the search task, a person cannot select an appropriate search strategy. Difficulty in finding a target even after repeated scanning may be partially explained by irregularities in the persons UFOV.
3It seems necessary to quantify field shape as well as field size in order to develop better mathematical models of search performance. For example, Rantanen and Goldberg (1999) found that with increase in mental workload, visual fields became more irregular and less compact. Rantanen and Goldberg (1999) defined the visual field as the area in which a stimulus can be detected and the UFOV (or function nal visual field) as the area where more information must be extracted. For the type of research conducted here, the authors favor the term “visual lobe” because it connotes volume, but because the term does not enjoy wide usage at the moment, UFOV is used. Although lobe type volumes are important for visual performance it is usually only practical to measure a slice (an area) of that volume.
4The aims of the research reported here were: to do an extensive study of individual field shape characteristics, and; using a series of representative indices for characterising and quantifying UFOV shapes, to investigate the relationship between field shape and visual search time. Two experiments were conducted. Firstly, useful fields of view were mapped on 24 meridians to study the effects of field shape on visual search time. Using the correlation between shape indices and the search time, a set of representative shape indices could then be selected. The second experiment was to validate the chosen shape indices for search performance on a more difficult task. A regression model relating search time and shape indices was developed to utilize the chosen shape indices to predict search time. In the experiments reported here, UFOV shapes were mapped to investigate field irregularities, and, after investigating many mathematical descriptions of shape, 16 indices were chosen (see Section II). Here, presentation of stimuli and analysis of the results was achieved using “Visual Lobe Measurement System” (VILOMS), a programme developed by the authors for conducting the UFOV and visual search experiments (see Section III).
5Human search performance is consistently unreliable and often time-consuming (Drury & Spencer, 1998) so that search is typically allocated to visual image processing systems (Lumai, 1994). However, decision performance must often be allocated to people to provide the necessary flexibility in response to changing conditions (Hou, Lin, & Drury, 1993). The research reported here, explored the neglected UFOV shape factor in models of search and has the potential to be developed into a screening and training tool for inspectors.
II. SHAPE INDICES
6Potential methods for describing UFOV shape can be divided into two groups; one uses the attributes of a shape to generate a single index, the other emphasizes the perimeter of the shape. The perimeter methods do not provide a single index and are mathematically complex, using Fourier analysis, chain codes (Lu, 1997) and piecewise approximation (Luo, 1998). Harmonic analysis was not deemed practical for the purpose here so single indices were used to describe visual field shapes in this study.
7In 1822, Carl Ritter (Frolov, 1974) suggested shape measures with a single index description on compactness. The compactness measures compare the shape to a circle, which represents the most compact of all geometric shapes. A variety of procedures have since been employed in attempts to measure compactness and other shape attributes. These procedures vary in underlying approach and were developed for ease in computation and accuracy in characterizing a wide range of possible shapes. After investigating many of these procedures, 16 indices were chosen as capturing the major characteristics of UFOV type shapes for this study. The indices were put into five categories namely: sphericity, boundary smoothness, symmetry, elongation, and regularity (Table 1).
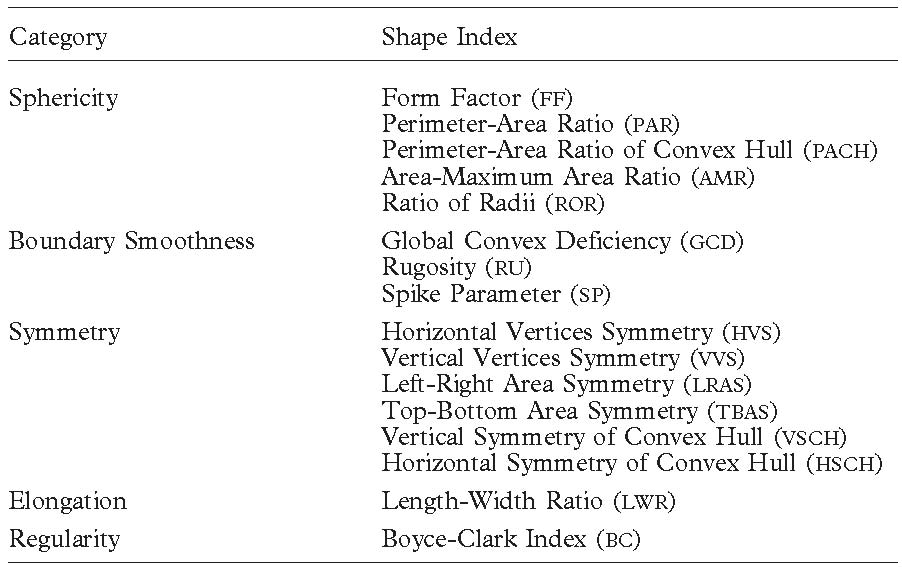
Les cinq catégories d’indices de forme de champ visuel utilisés dans la présente étude
8Sphericity compares the shape of an object to a circle, and because the circle is the most compact shape sphericity was called a “compactness” measure. For a simple shape there is a clear relationship between sphericity and the perimeter and area. Perimeter and area are not expressed in the same units but squaring the perimeter value or taking the square root of the area eliminates this problem. One perimeter and area measure is Form Factor (Russ, 1989):

9Another such measure Perimeter-Area Ratio has a constant 0.282 as follows:

10Both measures are 1 for a circle and a value close to 0 for a strip shape. Luo (1998) suggested a modified measure, where instead of computing the perimeter and area ratio of the shape itself, a convex hull is used. A convex hull is the minimum enveloping boundary with no concavities that can be fitted to the shape. Perimeter-Area Ratio of Convex Hull is:

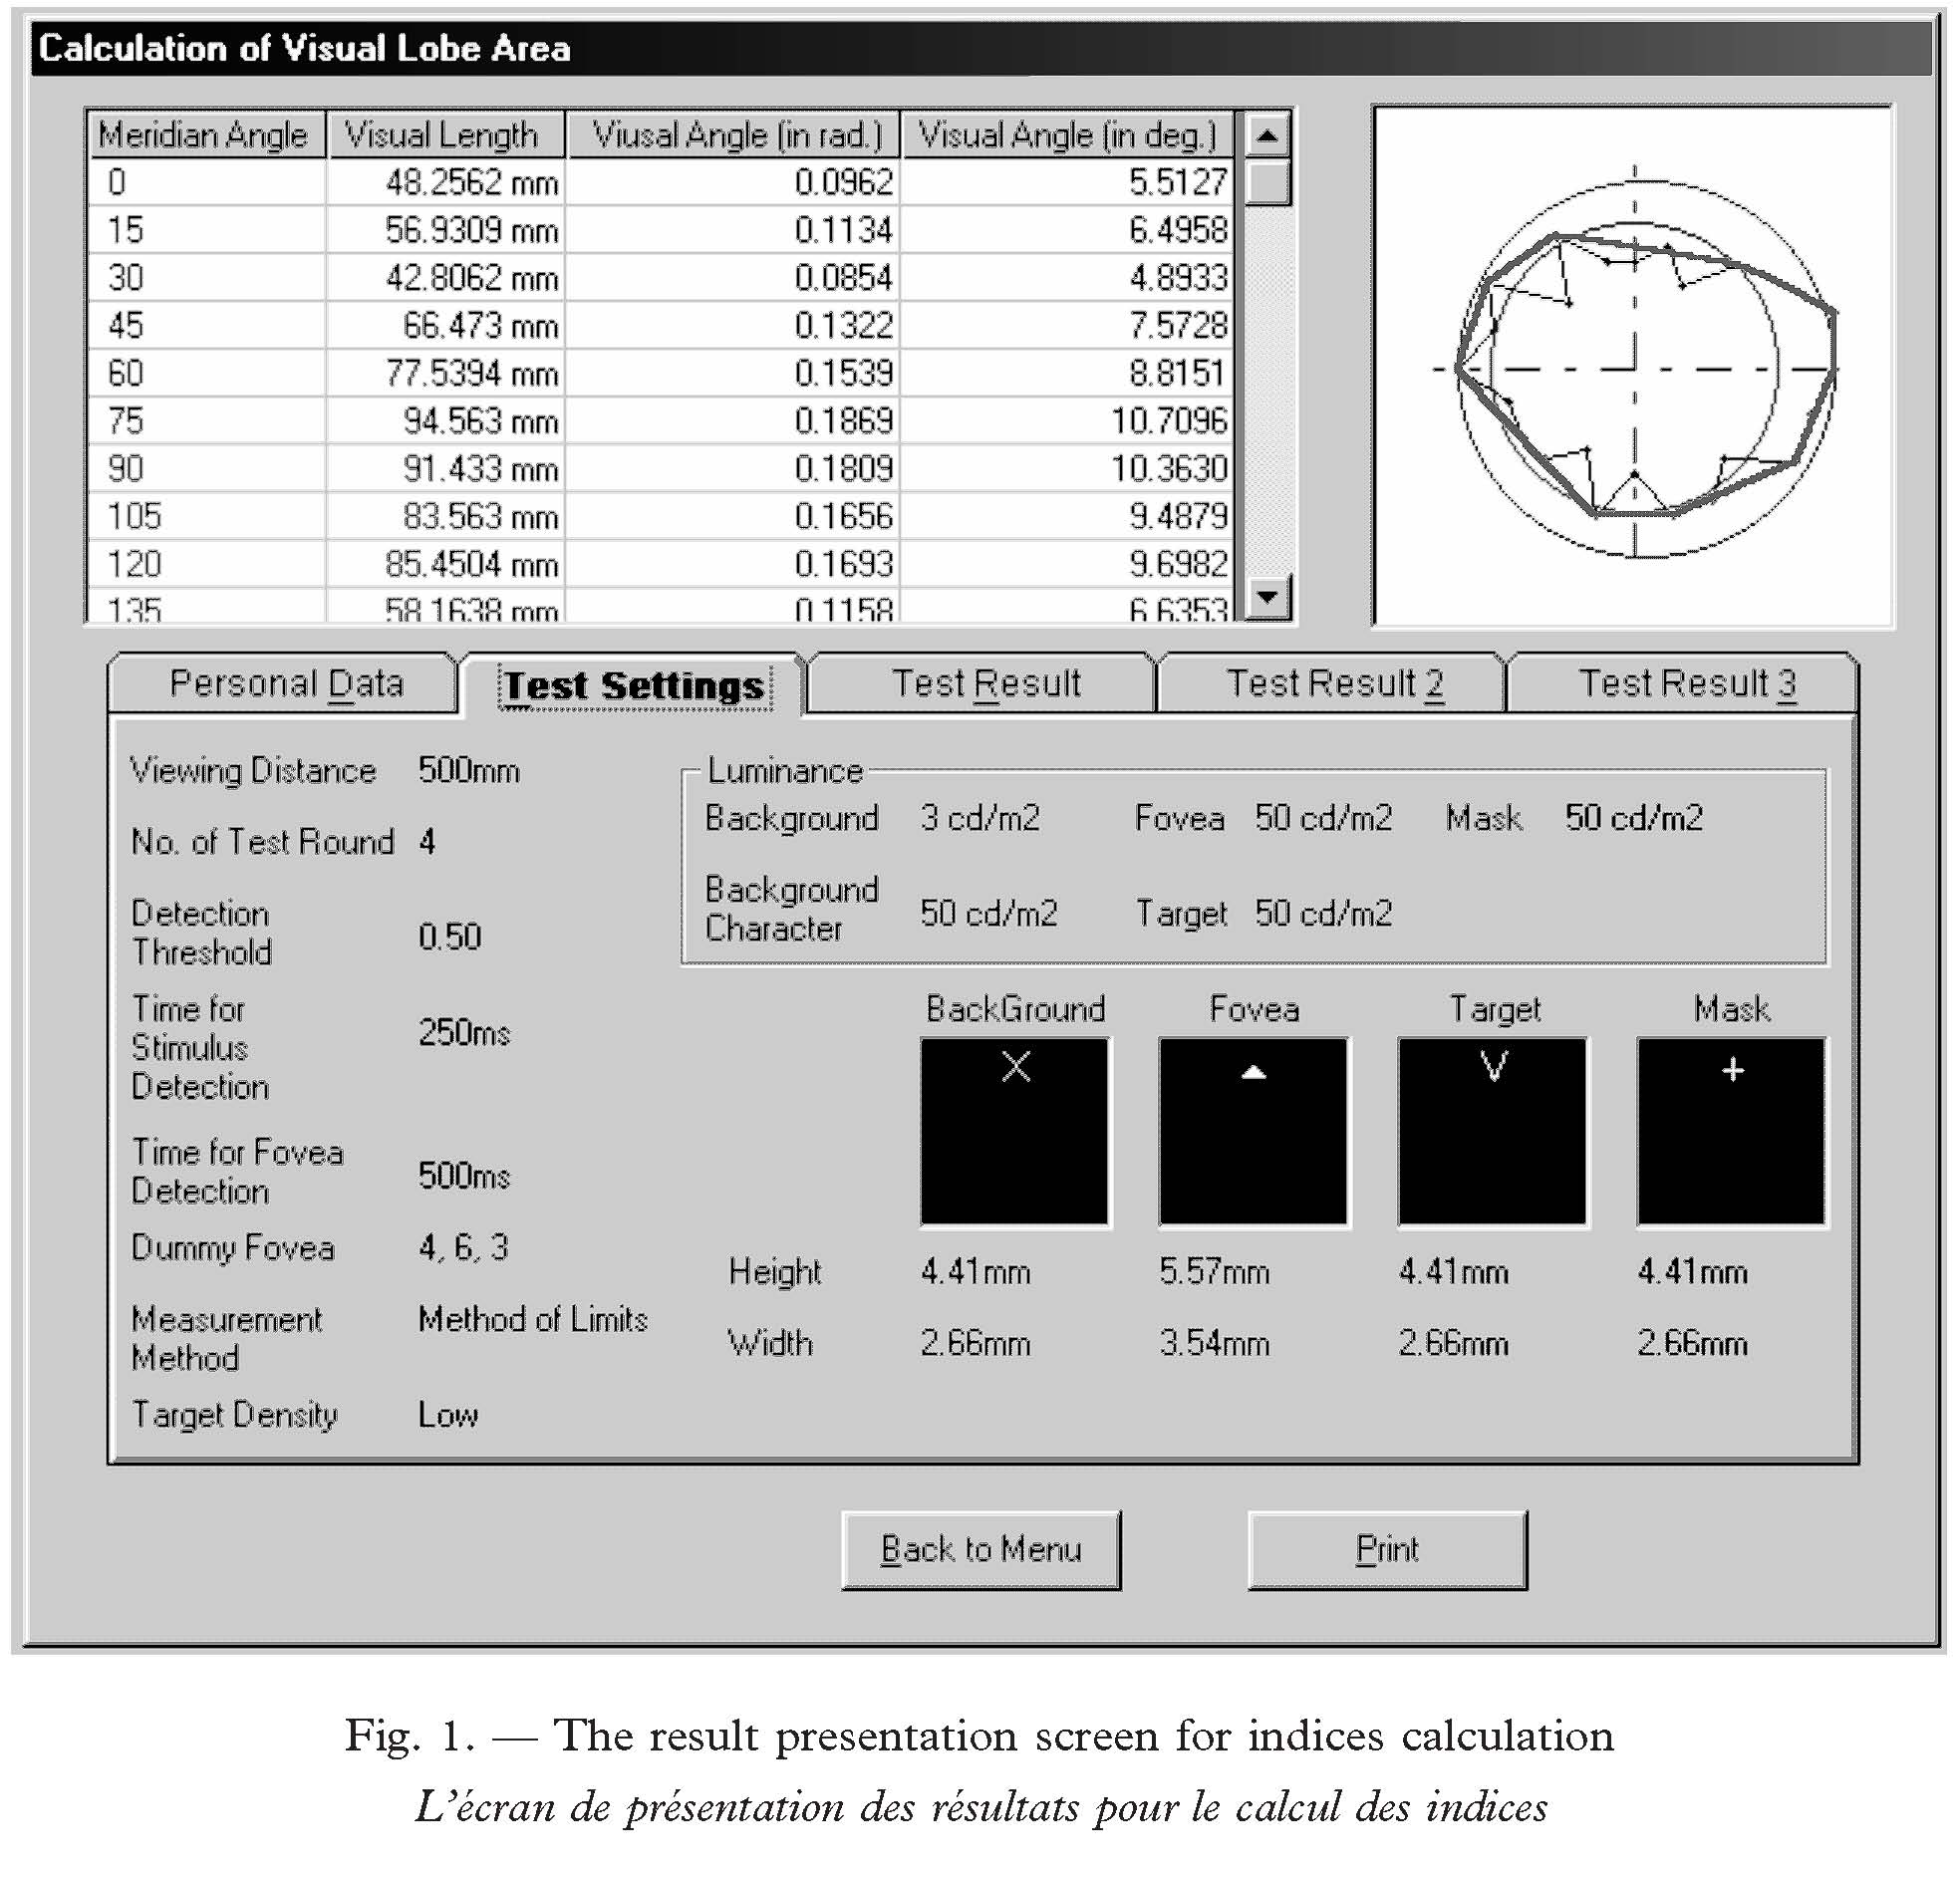
11A value of 0 represents a line and1 is circular.
12A second group of sphericity measures are based on the smallest circle that can circumscribe the shape and the circle having the same area as the shape (equivalent circle). Area-Maximum Area Ratio is one such measure:

13A related measure, Ratio of Radii, was suggested by Schumm (1963) as:

14The Ratio of Radii and the Area-Maximum Area Ratio produce values of 1 for a circle and get smaller when the shape deviates from being circular.
15Some boundary smoothness measures are convex hull related. Global Convex Deficiency depicts the “porosity” between the nominal shape defined by the convex hull and the actual shape outline. It was expressed by Luo (1998) as:

16From Hawkins (1993), the Rugosity was defined as:

17Global Convex Deficiency yields a value of 0 and Rugosity yields a value of 1 for an absolutely smooth shape without indentations and both measures increase as the shape gets rougher. A non-convex hull measure of Boundary Smoothness is Spike Parameter (SP) (Stachowiak, 2000) obtained by averaging “spike values”, based on representing the shape by a set of triangles constructed on different scales. The boundary is “walked” around at a fixed step size and each step is represented by a “triangle”. “Spike value” is a numerical parameter measure of the sharpness and size of the triangles i.e. shape angularity, and can vary between zero and one. SP is calculated by summing individual spike values and is 1 for absolutely smooth shapes, decreasing to zero as the shape gets more angular (for a more detailed description see Stachowiak, 2000).
18Symmetry depicts the similarity of two halves of a shape when it is divided by a virtual meridian. Evaluation of Vertices Symmetry is generally based on the difference in lengths of corresponding vertices to the virtual axis. Horizontal Vertices Symmetry can be expressed as:

19where XRi and XLi are the horizontal distances of the vertices of the ith right and left meridians from the vertical axis being compared. Similarly, Vertical Vertices Symmetry can be expressed as:

20where XTi and XBi are the vertical distances of the vertices of the ith top and bottom meridians from the horizontal axis being compared. Both measures are 0 for symmetric shapes and increase up to 1 as the shape gets more asymmetric. The concept of Area Symmetry can be formulated similarly. Left-Right Area Symmetry is expressed as:

21where L is the area of the left quadrants while R is the area of the right quadrants. The Top-Bottom Area Symmetry is expressed as:

22where T is the area of the upper quadrants while B is the area of the lower quadrants. Both measures of Area Symmetry yield 0 for symmetric shapes and increase to 1 as shapes get more asymmetric.
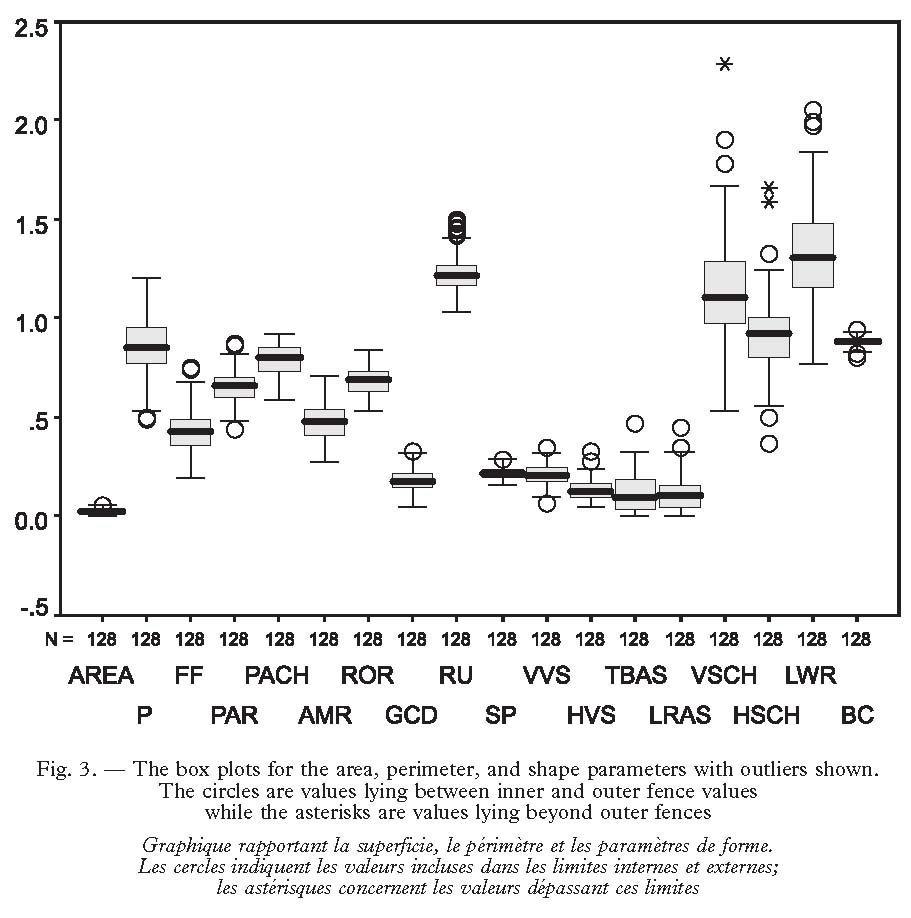
23Luo (1998) defined the half widths of a Convex Hull as the height of the highest vertices of the lower half and the upper half of the convex hull respectively and from this measure the Symmetry of Convex Hull is expressed as:

24where Sh is the Horizontal Symmetry of Convex Hull and Wmax L and Wmax R are the left and right half widths of the convex hull respectively and:

25where Sv is the Vertical Symmetry of Convex Hull and Hmax B and HmaxT are the bottom and top half widths respectively. A perfectly symmetric shape is 1. Values less than 1 result for shapes with longer top and right half widths, and values larger than 1 for longer bottom and left half widths.
26Hawkins (1993) describes a measure of the degree of elongation, or anisometry of a grain, namely Length-Width Ratio developed by Schneiderhohn (1954) and expressed as:

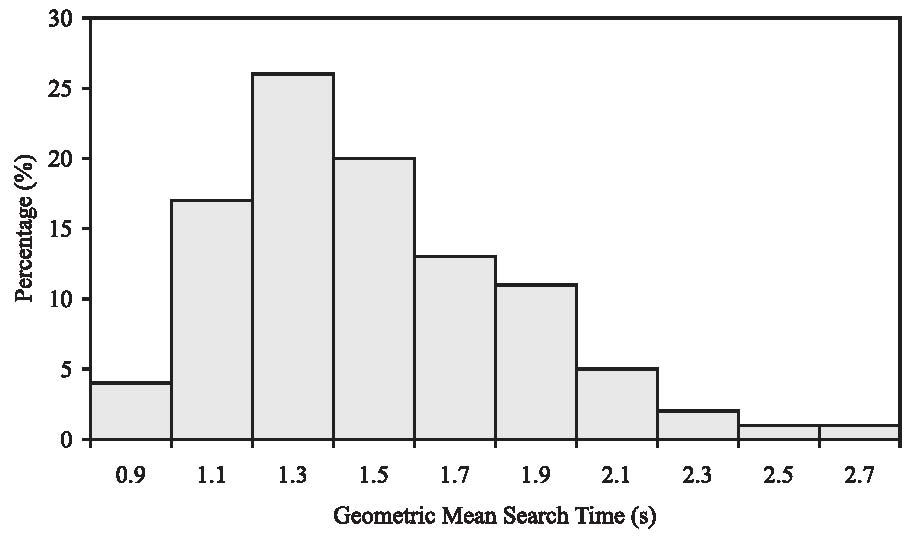
27where B is the greatest width and L is the greatest length.
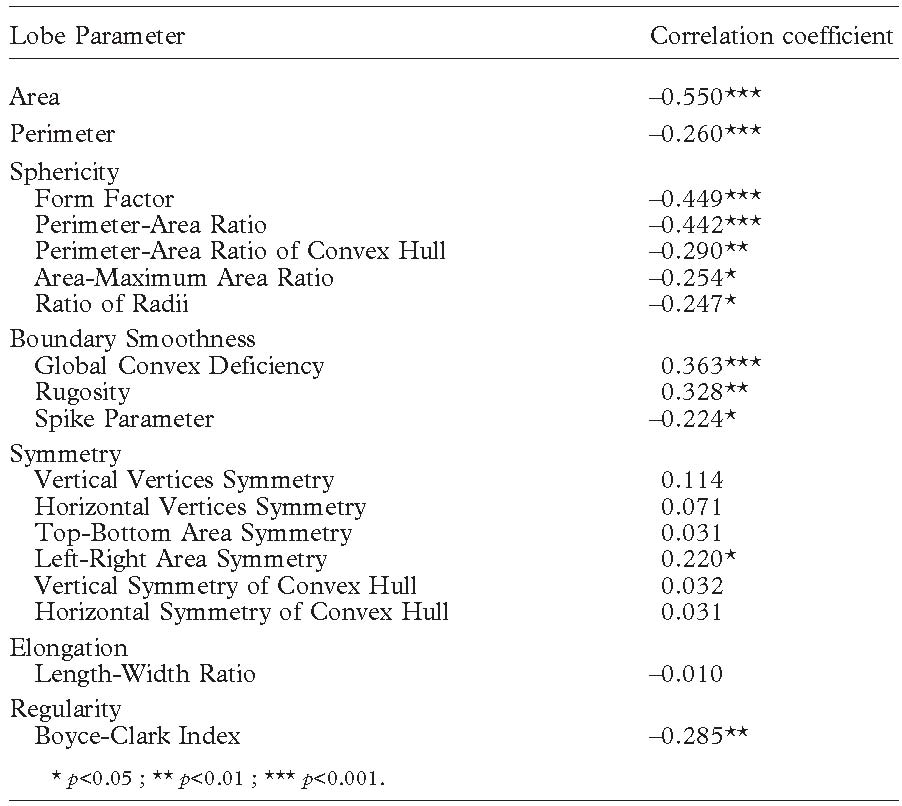
28Here L and B will be measured horizontally and vertically, respectively. The value is 1 for a square, smaller than 1 for vertically elongated shapes and larger than 1 for horizontally elongated shapes.
29Boyce and Clark (1964) developed a radial line method for direct comparison of a shape to a standard. A set of equally spaced radials are drawn from a reference point within a shape to its perimeter. For example, for a circle with the centre as reference point, all radials would be of equal length. Boyce and Clark (1964) presented the measure in the form:

30where ri is the length of radial i from a reference point, and n is the number of radials. The index ranges from 0 for a circle to 200 for a line. A modified Boyce-Clark Index equation was used here to produce a more practical range decreasing in value from 1 for a circle to 0 for a straight line as follows:

31Variable components considered in the Boyce-Clark Index are the number, orientation and reference point for the radials. In this study, there were 24 meridian based radials and the reference point was foveal fixation.
III. VISUAL LOBE MEASUREMENT SYSTEM (VILOMS)
32The Visual Lobe Measurement System (VILOMS) used here was developed by the authors to let the experimenter design and automatically present a wide variety of targets against homogeneous backgrounds for UFOV experiments, where the task is to detect a single target amongst the background of non targets. The system can use method of limits strategy to reduce the number of mapping exposures required, and the system collects information about meridian lengths and UFOV shape, plots the shape and calculates the shape indices. VILOMS is developed in Microsoft® VISUAL BASIC Professional Edition 6.0® with an OCX component HITIME® by Mabry® Software Inc. There is a user-friendly interface and a full set of record filing and retrieval systems. There are five main function modules: Visual Lobe Measurement, Index Calculation, Measurement Method, Resume Unfinished Measurement, and Load Previous Records. The core module is “Visual Lobe Measurement”. When a UFOV measurement is started, a personal information screen is shown to collect relevant personal data, then VILOMS starts the UFOV measuring process by displaying the preset stimulus screens, and logs and judges the correctness of responses.
33As soon as the UFOV has been delineated in accordance with the settings, a “Test Completed” message is displayed and a Result Presentation screen is used to display personal data, measurement environment and UFOV shape. The “Index Calculation” module uses the number and lengths of meridians and the distance between the subject and the stimulus display to calculate and display UFOV shape and generate shape indices (Figure 1). The “Measurement Method” sets up the experimental environment using the variables: subject to screen viewing distance; stimulus screen size; boundary detection method; exposure durations for fixation and stimulus presentation; number of mapping meridians, and; choice of target, background and masking characters. The “Resume Unfinished Measurements” function allows the experimenter to suspend a test and save the measurements so the test can be resumed later. The “Load Previous Records” module displays the results of previous UFOV measurement and index calculations.
34During target exposure, a special feature “Fovea Fixation Mechanism” (FFM) was used to ensure foveal fixation. FFM employs one valid and three null foveal characters. The null and valid foveal characters are triangles pointing north, west, south, east displayed at the fixation point in turn and the subject must respond only to the valid one e.g. north, with a mouse click. A valid response ensures that the subject is looking at the fixation point and this is a conditional requirement for the system to present and process a stimulus trial. The four foveal characters are presented at random times with exposure time as specified during setup. FFM is a light mental workload (Rantanen & Goldberg, 1999) and is expected to have only a small effect on UFOV shape.
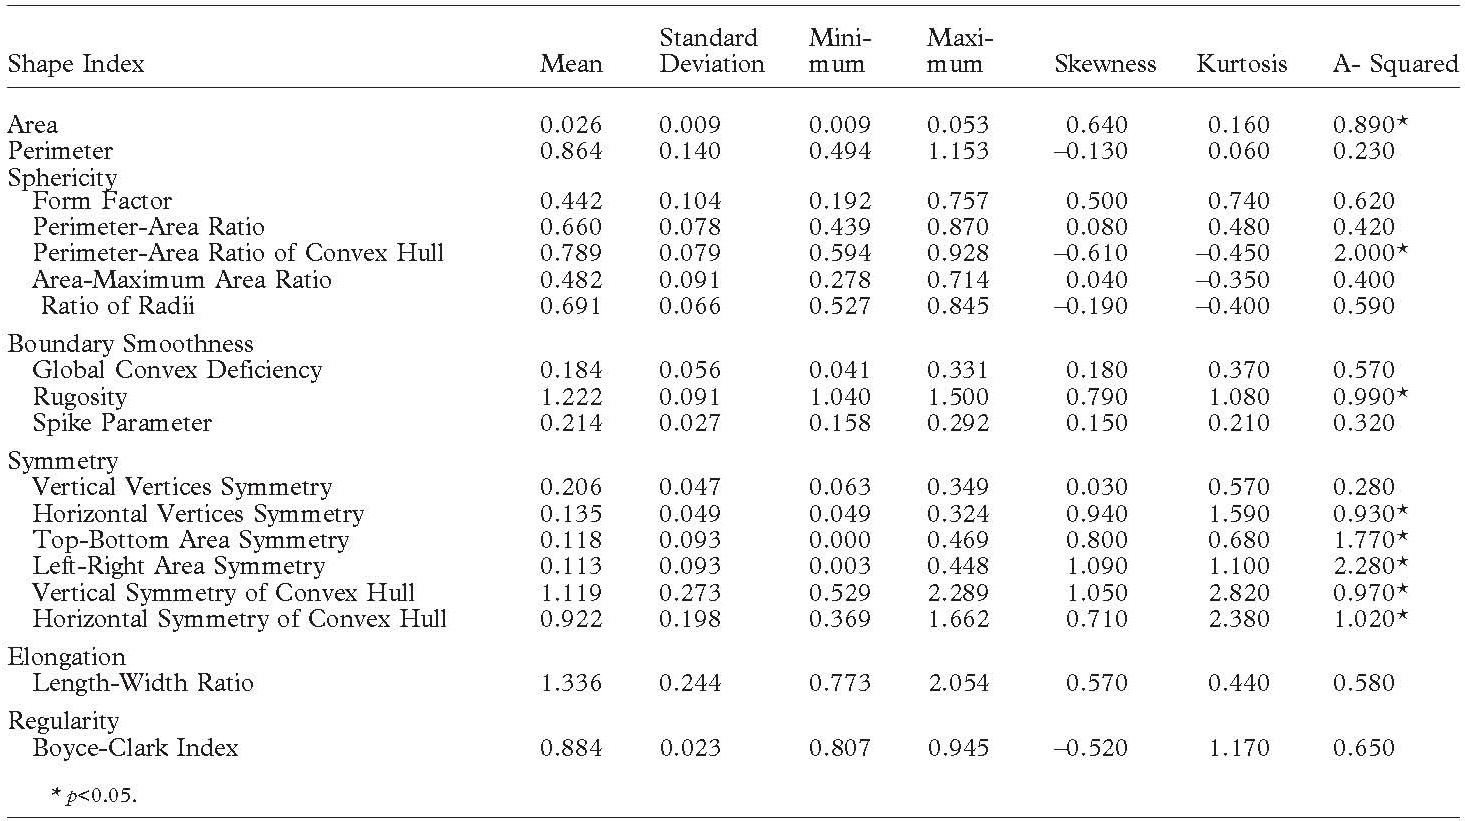
Statistiques descriptives des champs, des périmètres et des 16 indices de forme
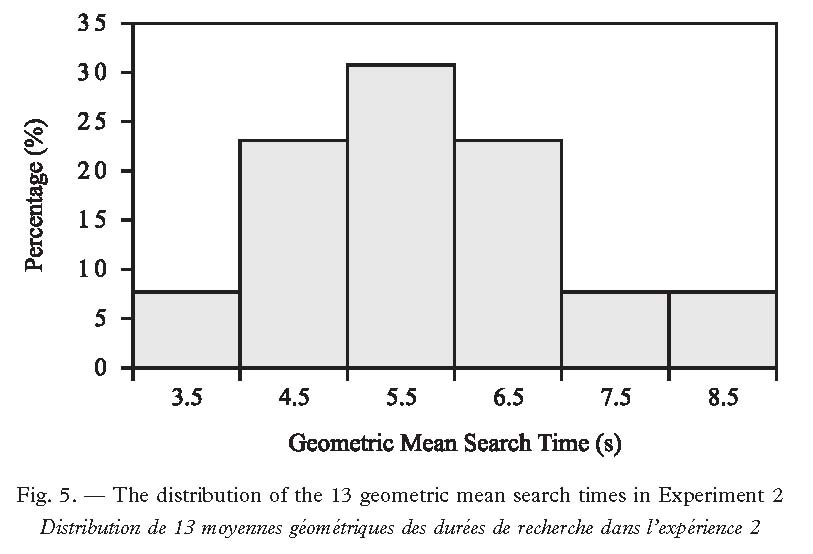
IV. EXPERIMENT 1
35This experiment was to map 24-meridian useful fields of view, to calculate shape indices and to study the effects of symmetry, regularity, compactness, boundary smoothness, and elongation of UFOV shape on visual search time. Using correlations between the shape indices and the visual search time, a set of representative shape indices could then be selected.
IV . 1. METHOD
IV . 1 . A. Subjects
36One hundred and one volunteer Hong Kong Chinese undergraduates (73 males, 28 females) with ages ranging from 20 to 24 (median, 21) participated in this study. All the subjects had near foveal acuity of at least 20/25 Snellen (Bausch and Lomb Orthorator) and none had previous experience with this type of visual search task.
IV . 1 . B. Stimuli
37Visual Lobe Mapping: VILOMS generated and presented the stimuli on twenty four imaginary regularly spaced meridians originating at central fixation to provide a reasonably full field map. In each presentation, a single target (V) appeared randomly at one of the 214 target positions on the 24 meridians, whilst 419 background Xs filled all other positions to form a uniform two-dimensional test field of 21o (width)×16o (height). No targets were placed on the outside edges, so that all targets were completely surrounded by Xs. Viewing distance was 500 mm with the farthest eccentricities tested being 14o from fixation on the diagonal meridians. Each visual object subtended 19 min arc horizontally and vertically with centres separated by 72 min arc. Each stimulus was shown for 250 msec, which was short enough to minimize saccadic eye movements during stimulation. A post-exposure mask presented immediately after stimulation, filled all background object and target positions with “+”s’ of the same size as the test stimuli. Background luminance was about 4 cd/m2 and luminance of the objects was 25 cd/m2 (contrast ratio 6.25).
38Visual Search Test: The stimuli and experimental setting were the same as for the UFOV measurement, including post exposure masking. The luminance of all the visual objects was 25 cd/m2 and the background luminance was 6 cd/m2 (contrast ratio 4.12).
IV . 1 . C. Apparatus
39An AMD Athon 1200 MHz microprocessor with a 17-inch monitor presented the stimuli. Subjects controlled stimulus presentation and inputted estimated target positions with a mechanical mouse. An adjustable chair ensured that line of regard was roughly perpendicular to and at the centre of the screen.
IV . 1 . D. Procedure
40Near acuity of the subjects was measured (Bausch and Lomb Orthorator) before the tests and the Visual Lobe Mapping sessions were conducted prior to the Visual Search Test sessions. Before UFOV mapping, the subjects were given written instructions and performed 10 practice trials. The method of limits was used to determine boundary limits on the meridians. Depending on ability, the number of exposures ranged from 350 to 600 for complete 24-meridian mapping. A 5-minute break was given for every 15 minutes of measurement (after about 200 presentations). The measurement could generally be completed within 30-45 minutes. FFM ensured central fixation and after stimulus presentation, the masking characters appeared and the subjects left clicked a cursor at their chosen location on the screen. The masking disappeared after input of estimated target position. A correct response was defined as a curser position click within two character-spaces of the actual target location. UFOV shape features were then quantified by VILOMS as described in Section II. Four subjects were retested using the same procedure to establish reliability.
41Visual Search Testing followed Visual Lobe Mapping using the same stimuli and a similar procedure, except that each stimulus was presented until the subject found the target. Written instruction and 10 practice trials were given, followed by self-paced search time measurements. FFM ensured central fixation and then a stimulus with one randomly located target was presented. Subjects reported target detection by a left-button mouse click and then the masking characters appeared. Subjects clicked the right-button mouse on a masking character position to enter their estimated target location. The masking stimuli disappeared. A correct response was defined as the exact location of the target character. If the response was incorrect, that particular target location was randomly presented again to ensure each target location was successfully searched. The testing stopped when all 96 targets presented had been correctly located. Visual search time was the interval between onset of stimulus display and the left-button mouse click. Incorrect response times were discarded. Overall time for the tests varied according to performance but was generally about 15 minutes.
IV . 2. RESULTS
IV . 2 . A. Visual Lobe Mapping
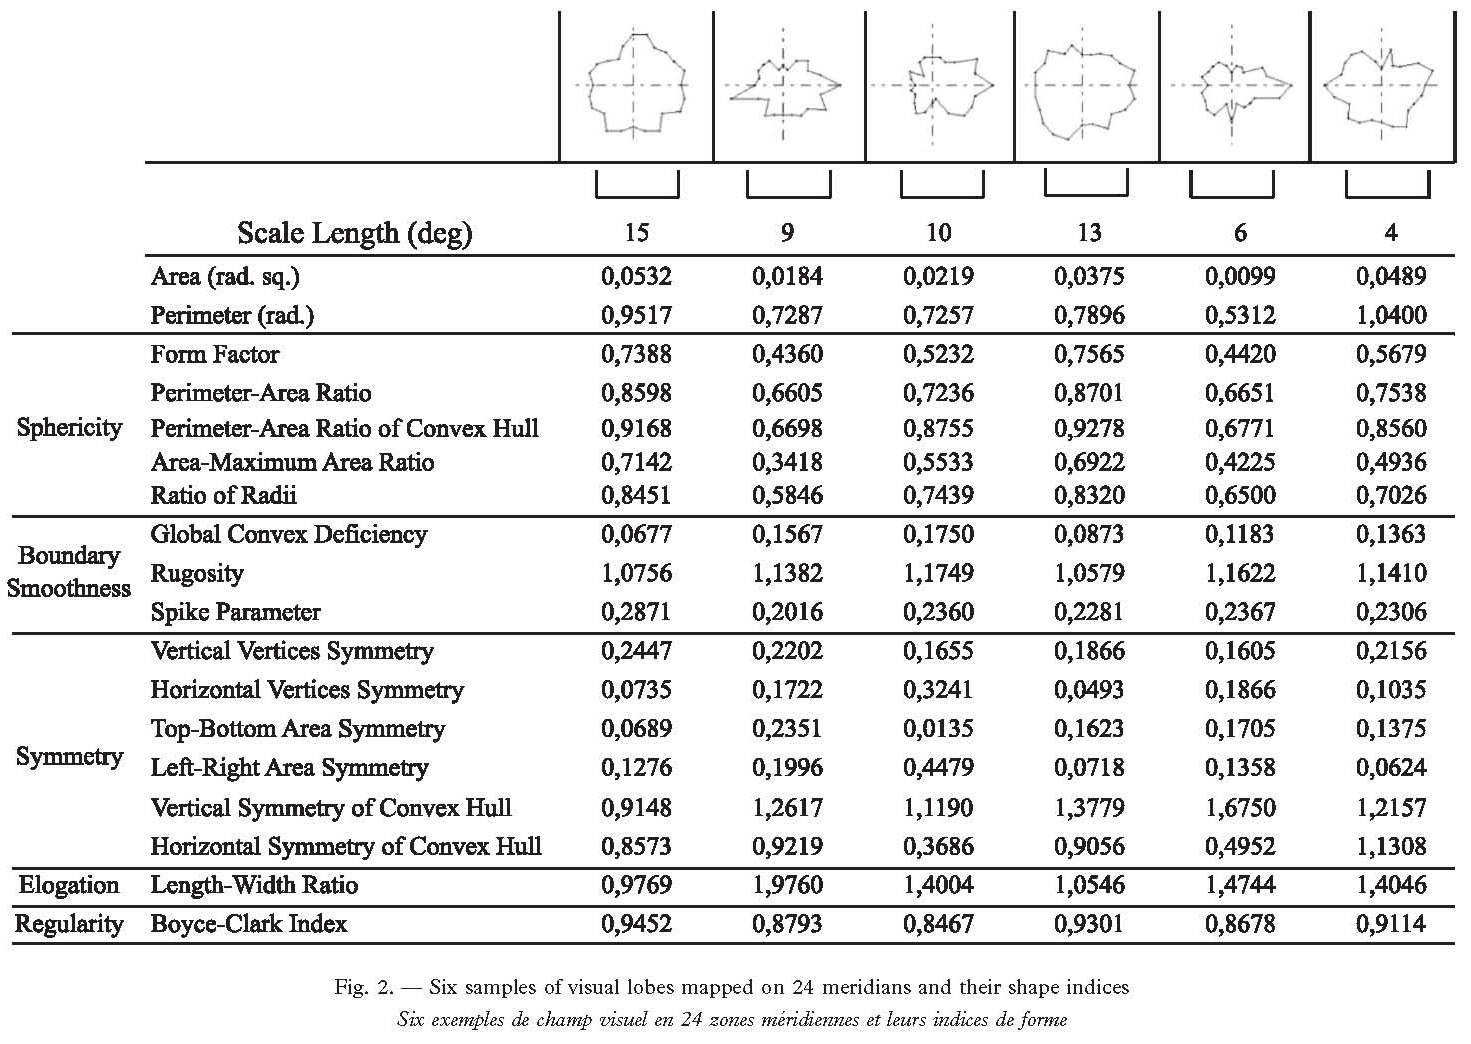
42Some 24-meridians UFOV shapes are shown in Figure 2. There were large individual differences, and most of the shapes were irregular and not very ovaloid or circular. Descriptive statistics of the shape indices are summarized in Table 2. Individual differences and variation in data may be examined through outliers (Ogawa et al., 2003) where an outlier is defined as follows (Shinjo, 1995):
43Outlier < Q1–(Q3–Q1)*1.5 or Q3+(Q3–Q1)*1.5 < Outlier
44where Q1 indicates the bottom quartile and Q3 the top quartile.
45Outliers were subjects that had rather unusual characteristics for a particular shape parameter. Values of the shape parameters are shown as box plots in Figure 3 and these data were used to assess individual differences in the shape parameters. There were outliers in all shape parameters apart from Perimeter-Area Ratio of Convex Hull (PACH), Area-Maximum Area Ratio (AMR), and Ratio of Radii (ROR). There were 1.91% outliers for all shape indexes.
46The mean values of shape indexes in the sphericity category ranged from 0.442 to 0.789 (55.8% to 21.1% smaller than 1 for circles), indicating a medium level of UFOV roundness. For boundary smoothness, mean Rugosity (1.222) was reasonably close to 1 for an absolutely smooth shape. Mean Global Convex Deficiency (0.181) was near the zero value for absolute smoothness. In general the UFOV boundaries showed a low level of roughness. For irregularity, mean Boyce-Clark Index (0.884) was 11.6% smaller than 1 for a circle, showing a slight UFOV shape irregularity. The mean Length-width Ratio (1.336) indicated that the fields 33.6% longer horizontally than vertically. For symmetry, 0 is symmetric and 1 asymmetric. The four indices of vertex and area symmetry varied from 0.113 to 0.206, indicating that in general the shapes were symmetrical. The Vertical Symmetry of Convex Hull (1.119) showed that the bottom field length was 11.9% greater than the top field length, and for Horizontal Symmetry of Convex Hull (0.922) the left field length was 7.8% smaller than the right field length.
47Anderson-Darling normality tests on the shape indices are shown in Table 2. Area, Vertical Symmetry of Convex Hull, Horizontal Symmetry of Convex Hull, Perimeter-Area Ratio of Convex Hull, Rugosity, Top-Bottom Area Symmetry, Left-Right Area Symmetry, and Horizontal Vertices Symmetry did not follow the normal distribution (p<0.05). Form Factor, Rugosity, Horizontal Vertices Symmetry, Top-Bottom and Left-Right Area Symmetry, Vertical and Horizontal Symmetry of Convex Hull, and the Length-Width Ratio were positively skewed while Perimeter-Area Ratio of Convex Hull, and Boyce-Clark Index were negatively skewed. Positive kurtosis was found for Form Factor, Perimeter-Area Ratio, Rugosity, Vertical and Horizontal Vertices Symmetry, Left-Right Area Symmetry, Vertical and Horizontal Symmetry of Convex Hull and Boyce-Clark Index. Negative kurtosis was found for Perimeter, Perimeter-Area Ratio of Convex Hull, and Ratio of Radii.
48Sensitivity limits along meridians were determined using the method of limits with four alternately ascending and descending trials on each meridian. A retest on four subjects to establish reliability of this psychophysical procedure found that field area, perimeter, and shape parameters were similar to those in the main test and no significance differences were found between the test and retest sessions (d.f.=71, p<0.01).
IV . 2 . B. Search Times
49Performance accuracy was measured using the ratio of target locations (96) to number of presentation needed to correctly locate all targets. Ninety-three of the 101 subjects scored 100% accuracy and eight scored 95% to 99%, showing the task was quite easy. Geometric mean of the 96 search times for each subject was taken as the measure of visual search performance. Geometric means are less vulnerable to extreme values than arithmetic means, and geometric mean search time (GMST) has been widely used in visual search studies (Monk, 1976; Kee, Jung, & Chung, 1992). The overall arithmetic mean of the 101 GMSTs was 1.493 seconds. Figure 4 shows the distribution of GMSTs and Table 3 summarizes descriptive statistics for the times. Assuming average glimpse duration of 300 msec (Chan & Courtney, 1993), the search task used here required an average of only five glimpses.

Moyennes géométriques et statistiques descriptives des 13 durées de recherche de l’expérience 1
IV . 2 . C. UFOV and Search Times
50Using individual field mapping results and search times, correlation analyses were performed to test for relationships between UFOV characteristics and visual search performance (Table 4). There were highly significant correlations between search times and the UFOV measures of area and perimeter, and the shape indices for sphericity, boundary smoothness, and regularity. The highest correlation was between search time and Area. The Sphericity indices of Form Factor and Perimeter Area Ratio were the highest and second highest shape indices respectively correlated with search time (Table 4). The Boundary Smoothness indices Global Convex Deficiency and Rugosity were also highly correlated with search time. All significant correlations were negative except for Global Convex Deficiency, Rugosity and Left-Right Area Symmetry.
Corrélations entre durée de recherche et caractéristiques du champ
IV . 3. DISCUSSION
51The 24-meridian binocular visual fields measured here for 101 subjects were found to be irregular, with very marked differences between the subjects as shown by the outlier analysis. There were large dispersions in the shape indices indicating that individual useful fields of view were distinct in terms of sphericity, boundary smoothness, symmetry, elongation and regularity. Most of the shape indices in the categories of sphericity, boundary smoothness, elongation and regularity followed the normal distribution. Comparisons of shape indices with theoretical values for circles showed that in general the useful fields of view were slightly irregular with a low level of sphericity, boundaries were moderately rough, and they were horizontally elongated and slightly asymmetric along both axes.
52Correlation analysis here confirmed the well established relationship between search time and the UFOV area (Courtney & Chan, 1986; Gramopadhye, Drury, Jiang, & Sreenivasan, 2002). In fact, this was the highest correlation found out of all the UFOV attributes considered. There were also significant relationships between search time and the field shape attributes of sphericity, boundary smoothness and regularity. The negative correlations between search time and the indices Form Factor, Perimeter-Area Ratio and Perimeter-Area Ratio of Convex Hull showed that the more compact the UFOV, the shorter the search time. Shape indices Global Convex Deficiency and Rugosity quantified boundary smoothness, or “wrinkleness”, of the field shape. Positive correlation meant visual search time increased with roughness and wrinkleness of field boundary. These correlations suggest, not surprisingly, that search will be more efficient with a large, compact and preferably near circular field shape. In general, shape symmetry and the degree of elongation of the field did not influence search time. The only shape symmetry index that correlated with the search time was Left-Right Area Symmetry, which exhibited a weak correlation (p<0.05). The attributes of shape symmetry and elongation do not affect the effective coverage of the search area. It may be that a person can, albeit not consciously, develop adaptive search strategies to cope with asymmetric and elongated field shape to make effective use of the shape.
53The field shape attributes of sphericity, boundary smoothness, and regularity correlated with visual search time. Within these shape attribute categories, Form Factor (sphericity), Global Convex Deficiency (boundary smoothness), and Boyce-Clark Index (regularity) were the shape indices that exhibited the most significant correlations with visual search time. Therefore, these were the indices selected as the group to describe those aspects of field shape expected to be important for search performance. The validity of this expectation was tested in Experiment 2.
V. EXPERIMENT 2
54This second experiment was conducted to validate the set of chosen shape indices with visual search performance on a similar but more difficult search task than that used in Experiment 1. The search stimulus field size was larger and there were more background targets than for Experiment 1. The target in Experiment 1 was “V” but here the much more difficult “Y” target was used (Bellamy & Courtney, 1981). From the results of both experiments, a regression model relating search time with the selected set of shape indices was developed demonstrating the ability of the selected shape indices to predict visual search time.
V . 1. METHOD
V . 1 . A. Subjects
55Out of the 101 subjects that took part in Experiment 1, 13 volunteer subjects participated in this experiment. There were six males and seven females with ages ranging from 20 to 24 years (median=21).
V . 1 . B. Apparatus and Software
56The software and apparatus used in Experiment 2 were the same as the Visual Search Test of Experiment 1 except that the 17-inch monitor was replaced with a Kodak DP1100 projector.
V . 1 . C. Stimulus Material
57Each stimulus contained only one target “Y” amongst a background of regularly spaced “X”s. The search field was 123% larger, there were 240% more targets and density was 40% higher than for Experiment 1. The target “Y” was more difficult than “V”, because of its greater similarity to the background “X”s (Courtney, 1984; Courtney, 1985; Duncan & Humphreys, 1989). The “Y” target was embedded in a uniform two-dimensional test field of 30o (width)×25o (height) with 1183 background “X”s. Subjects viewed the display at 2300 mm and the farthest eccentricity tested was at 16o on the diagonal meridians. Each visual object subtended 22 min arc both horizontally and vertically with centres separated by 44 min arc. The object and background luminance were same for Experiment 1.
V . 1 . D. Procedure
58The procedure for this Visual Search Test was the same as for Experiment 1 except that the stimuli were projected and the task more difficult (as outlined above). The more difficult task here took about 40 minutes compared to about 15 minutes in Experiment 1. A 5-minute break was given for every 15 minutes of testing.
V . 2. RESULTS
59All the subjects had an accuracy of 100% on the search task. The overall average of the13 geometric mean search times was 5.68 seconds, which means that on average each search took about 19 glimpses. Figure 5 shows the distribution of the 13 GMSTs and the summarized descriptive statistics for the search times are shown in Table 5. The task was much more difficult than the task in Experiment 1 where average time was 1.49 seconds and each search took about 5 glimpses.
60Correlation analyses between the geometric mean search times and the UFOV shape indices selected from Experiment 1 (Table 6) had the same signs for correlations as for Experiment 1, showing that the selected field shape indices had similar relationships to search time in both experiments. Regression models for search time and the representative visual shape indices were developed for data from Experiments 1 and 2 and the relevant adjusted r2 values were calculated (Table 7). Adjusted r2 value was used because it takes into account of the number of parameters used in the models and shows the contribution to variation of search performance by the respective shape indexes. Adjusted r2 values for the models with shape indexes were higher than those for the area alone (Table 7). However, these models may not contain the best subset of predictors (Kutner et al., 2004), so the backward selection method for choosing a final model with the most promising variable(s) was adopted. The results of backward selection showed that Area and Form Factor were the most significant factors influencing search performance in the easy task, while Area and Boyce-Clark Index affected the difficult task. Using the Boyce-Clark index in the regression model increased the r2 values by 63% for the difficult task.

Moyennes géométriques et statistiques descriptives des 13 durées de recherche de l’expérience 2
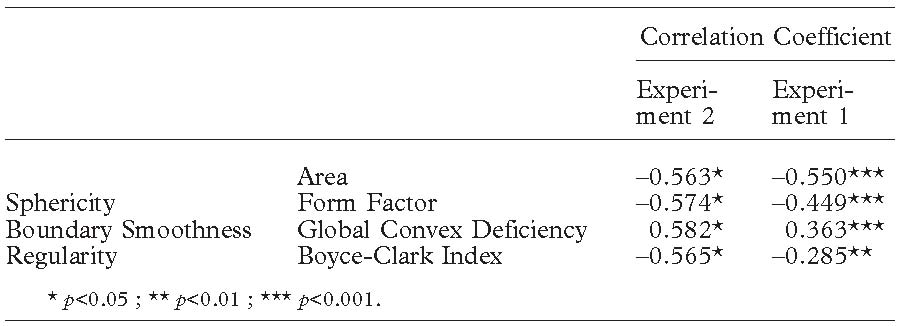
Comparaison des corrélations entre durées de recherche et indices représentatifs de forme dans l’expérience 1 et l’expérience 2, montrant la constance de la corrélation entre la forme du champ et la durée de recherche visuelle
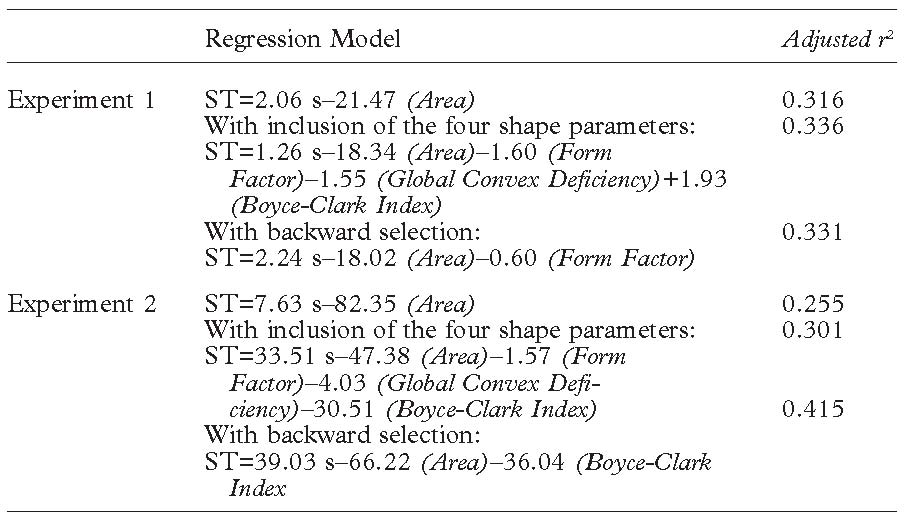
Modèles de régression prédisant la durée de recherche visuelle en fonction du champ visuel et des indices de forme, illustrant la variation de r2 lorsque est inclus l’ensemble des indices de forme
V . 3. DISCUSSION
61The greater difficulty of the search task in Experiment 2 was reflected in the much longer search times than found in Experiment 1. For both experiments search times correlated with the representative UFOV shape indices, even though the search tasks were rather different. Correlations from both experiments had the same signs, showing consistency in the relationships between field shapes and search times regardless of the differences in the difficulty of the search task. The consistency of the correlations found in the two experiments indicates the potential usefulness of shape indices to improve search performance prediction.
62Regression models developed to examine the usefulness of the representative shape indices chosen in Experiment 1 showed that adjusted r2 values for data from both experiments were increased; therefore, accuracy of the models was enhanced by use of the indices. The backward selection method showed that of all the shape measures, sphericity was the most significant one affecting search performance for the easier task while shape regularity was most significant for the more difficult task. The r2 values were not large in these models, probably due to the complex nature of search and the involvement of other factors, such as strategy. Nevertheless, there was a marked improvement in visual search time prediction by including the UFOV shape with area in the models.
VI. GENERAL DISCUSSION
63Experiment 1 demonstrated that 24-meridian binocular useful fields of view for a large number of subjects were irregular with very marked individual differences in shape indices. In general, the UFOV shapes were elongated horizontally with medium level of sphericitiy, and high levels of boundary smoothness, symmetry and regularity. For both experiments, field area produced the highest correlation out of all the UFOV attributes considered here, confirming previous findings that field area is a highly significantly factor in determining search performance. There were significant relationships between search time and the field shape attributes of sphericity, boundary smoothness and regularity, suggesting that search with large, compact and preferably circular field shapes will be efficient. However, shape symmetry and elongation did not affect search performance, maybe due to search strategies that adapt to cope with asymmetric and elongated field shapes. On the basis of the results from Experiment 1, the Form Factor (sphericity), Global Convex Deficiency (boundary smoothness), and Boyce-Clark Index (regularity) were selected as the group of indices of expected to be important for search performance, and the validity of this expectation was tested in Experiment 2. The search task used in Experiment 2 was considerably more difficult than the task used in Experiment 1, and the search times were accordingly longer. Nevertheless, correlations between search times from Experiment 2 and indices determined in Experiment 1 were very similar to correlations between the indices and search times from Experiment 1. The regression models developed showed that for both experiments there was a marked improvement in visual search time prediction by consideration of the UFOV shape indices in addition to field area.
64The work reported here demonstrated the possibility, with the use of the rapid and user-friendly VILOMS, for the direct and easy measurement of UFOV shape characteristics for large numbers of people. The use of field shape characteristics makes it possible to develop more accurate visual search models for performance prediction and determination of stopping time policy. Moreover, VILOMS provides a useful selection and training tool for industrial inspectors in order to make use of the significant relationship between field shape descriptors and search performance. Necessary but not sufficient conditions are that, for good search performance, potential inspectors should have compact and regular UFOV shapes, and large field areas.
ACKNOWLEDGEMENTS
65The work described in this paper was fully supported by a grant from the City University of Hong Kong [Ref. No. 7001512].
66Papert received: February 2005. Accepted by J. Patrick in modified form: February 2006.
REFERENCES
- Abramov, I., & Gordon, J. (1977). Color vision in the peripheral retina. I. Photopic spectral sensitivity. Journal of the Optical Society of America, 67, 195-202.
- Barbur, J. L. (1979). Visual Periphery. In J. N. Clare & M. A. Sinclair (Eds.), Search and the Human Observer (pp. 100-113). London: Taylor & Francis.
- Bellamy, L. J., & Courtney, A. J. (1981). Development of a search task for the measurement of peripheral acuity. Ergonomics, 24, 497-509.
- Boyce, R. R., & Clark, W. A. V. (1964). The concept of shape in geography. The Geographical Review, 54, 561-572.
- Brown, M. B. (1979). Mathematical approaches to modeling visual search. In J. N. Clare & M. A. Sinclair (Eds.), Search and the Human Observer (pp. 126-131). London: Taylor & Francis.
- Chaikin, J. D., Corbin, H. H., & Volkmann, J. (1962). Mapping field of short-time visual search. Science, 138, 1327-1328.
- Chan, A. H. S., & Courtney, A. J. (1993a). Inter-relationships between visual lobe dimensions, search times and eye movement parameters for a competition search task. The Annals of Physiological Anthropology, 12, 219-227.
- Chi, C. F., & Drury, C. G. (1998). Do people choose an optimal response criterion in an inspection task? IIE Transactions, 30 (3), 257-266.
- Courtney, A. J. (1984). A search task to assess visual lobe size. Human Factors, 26 (3), 289-298.
- Courtney, A. J. (1985). Development of a search-task measure of visual lobe area for use in industry. International Journal of Production Research, 23 (6), 1075-1087.
- Courtney, A. J., & Chan, H. S. (1985a). Eight-axis visual field mapping for targets embedded in a homogeneous competing background. Perceptual and Motor Skills, 60, 655-663.
- Courtney, A. J., & Chan, H. S. (1985b). Mapping the binocular visual field for a target embedded in a regular background. Perceptual and Motor Skills, 61, 1067-1073.
- Courtney, A. J., & Chan, H. S. (1985c). Visual lobe area for single targets on a competing homogeneous background. Human Factors, 27, 643-652.
- Courtney, A. J., & Chan, H. S. (1986). Visual lobe dimensions and search performance for targets on a competing homogeneous background. Perception & Psychophysics, 40, 1, 39-44.
- Courtney, A. J., & Chan, H. S. (1993). Visual lobe area mapping for targets on a competing homogeneous background. Journal of Human Ergology, 22, 115-130.
- Courtney, A. J., & Guan, L. (1996). Visual search performance with complete and incomplete visual lobe area. Ergonomics, 39, 749-756.
- Courtney, A. J., & Guan, L. (1998). Assessing search performance with a simulation model. Human Factors and Ergonomics in Manufacturing, 8 (3), 251-263.
- Drury, C. G. (1993). Exploring search strategies in aircraft inspection. In D. Brogan, A. Gale, & K. Carr (Eds.), Visual Search 2 (pp. 101-112). London: Taylor & Francis.
- Drury, C. G., & Prabhu, P. V. (1994). Human factors in test and inspection. In G. Salvendy & W. Karwowski (Eds.), Design of Work and Development of Personnel in Advanced Manufacturing (pp. 355-401). New York: Willey.
- Drury, C. G., & Spencer, F. W. (1998). Measuring human reliability in aircraft inspection. Proceedings of the 13th Triennial Congress of the International Ergonomics Association 1997, Tampere, Finland, 3, 34-35.
- Drury, C. G., & Wenner, C. A. (2000). Analyzing human error in aircraft ground damage incidents. International Journal of Industrial Ergonomics, 26, 177-199.
- Duncan, J., & Humphreys, G. W. (1989). Visual search and stimulus similarity. Psychological Review, 96, 433-458.
- Engel, F. L. (1971). Visual conspicuity, directed attention and retinal focus. Vision Research, 11, 563-576.
- Engel, F. L. (1974). Visual conspicuity and selective background interference in eccentric vision. Vision Research, 14, 459-471.
- Frolov, Y. (1974). Measuring of shape of geographical phenomena: A history of issue. Soviet Geography: Review and Translation, 16, 676-687.
- Gordon, J., & Abramov, I. (1977). Color vision in the peripheral retina. Hue and saturation. Journal of the Optical Society of America, 67, 202-207.
- Gramopadhye, A. K., Drury, C. G., Jiang, X., & Sreenivasan, R. (2002). Visual search and visual lobe size: Can training on one affect the other. International Journal of Industrial Ergonomics, 30, 181-195.
- Hawkins, A. E. (1993). Single number classification. The Shape of Powder-Particle Outlines, Research Studies Press Ltd., England, 38-70.
- Hong, S. K., & Drury, C. G. (2002). Sensitivity and validity of visual search models for multiple targets. Theoretical Issues in Ergonomics Science, 3 (1), 85-100.
- Hou, T. S., Lin, L., & Drury, C. G. (1993). An empirical study of hybrid inspection systems and allocation of inspection function. International Journal of Human Factors in Manufacturing, 3, 351-367.
- Ikeda, M., & Takeuchi, T. (1975). Influence of foveal load on the functional visual field. Perception and Psychophysics, 18, 255-260.
- Jung, E. S., Shin, Y., & Kee, D. (2000). Generation of visual fields for ergonomic design and evaluation. International Journal of Industrial Ergonomics, 26, 445-456.
- Kee, D., Jung, E. S., & Chung, M. K. (1992). Isoresponse time regions for the evaluation of visual search performance in ergonomic interface models. Ergonomics, 35 (3), 243-252.
- Kraiss, K. F., & Knaeuper, A. (1982). Using visual lobe area measurements to predict visual search time. Human Factors, 24, 673-682.
- Kutner, M. H., Nachtsheim, C. J., Neter, J., & Li, W. (2004). Applied linear regression models, 5th Edition, McGraw Hill Companies, Inc.
- Leachtenauer, J. C. (1978). Peripheral acuity and photo interpretation performance. Human Factors, 20, 537-551.
- Lu, G. (1997). An approach to image retrieval based on shape. Journal of Information Science, 23 (2), 119-127.
- Lumai, R. (1994). Image processing in manufacturing. In R. C. Dorf & A. Kusiask (Eds.), Handbook of Design, Manufacturing and Automation (Chap. 34). New York: Wiley.
- Luo, D. (1998). Shape analysis. Pattern Recognition and Image Processing, Horwood Publishing, 27-84.
- MacEachren, A. M. (1985). Compactness of geographical shape: Comparison and evaluation of measures. Geografiska Annaler, 102, 975-980.
- Monk, T. H. (1976). Target uncertainty in applied visual search. Human Factors, 18, 607-612.
- Ogawa, K., Hasegawa, S., Udaka, Y., Nara, K., Iwai, S., & Oguchi, K. (2003). Individual difference in the pharmacokinetics of a drug, pravastatin, in healthy subjects. The Journal of Clinical Pharmacology, 43, 1268-1273.
- Rantanen, E. M., & Goldberg, J. H. (1999). The effect of mental workload on the visual field size and shape. Ergonomics, 42 (6), 816-834.
- Russ, J. C. (1989). A simplified approach to harmonic shape analysis. Journal of Computer-Assisted Microscopy, 1, 377-396.
- Sanders, A. F. (1970). Some aspects of the selective process in the functional visual field. Ergonomics, 13, 101-117.
- Schneiderhohn P. (1954). “Eine vergleichende Studie über Methoden zur quantitativen Bestimmung von Abrundung und Form an Sndkornern”, Heidelb. Beitr. Miner, Petrogr., 4, 213-231.
- Schumm, S. N. (1963). Sinuosity of alluvial rivers on the great plains. Bulletin of the Geological Society of America, 74, 1089-1100.
- Shinjo, A. (1995). A Guide to Basic Statistics by PC SAS. Tokyo: Tokai University Press.
- Stachowiak, G. W. (2000). Particle angularity and its relationship to abrasive and erosive wear. Wear, 241, 214-219.
- Stark, L., Yamashita, I., Tharp, G., & Ngo, H. X. (1993). Search patterns and search paths in human visual search. In D. Brogan, A. Gale, & K. Carr (Eds.), Visual Search 2 (pp. 37-58). London: Taylor & Francis.
Mots-clés éditeurs : Mots-clés: Champ visuel utile, Performance, Recherche visuelle
Date de mise en ligne : 01/02/2008
https://doi.org/10.3917/th.704.0343