The Demography of Sub-Saharan Africa from the 1950s to the 2000s
A Survey of Changes and a Statistical Assessment
- By Dominique Tabutin,
- Bruno Schoumaker,
- Translated by Mireille Rabenoro
Pages 455 to 555
Cite this article
- TABUTIN, Dominique,
- SCHOUMAKER, Bruno,
- Translated by RABENORO, Mireille,
- Tabutin, Dominique.,
- et al.
- Tabutin, D.,
- Schoumaker, B.,
- Translated by Rabenoro, M.
https://doi.org/10.3917/popu.403.0521
Cite this article
- Tabutin, D.,
- Schoumaker, B.,
- Translated by Rabenoro, M.
- Tabutin, Dominique.,
- et al.
- TABUTIN, Dominique,
- SCHOUMAKER, Bruno,
- Translated by RABENORO, Mireille,
https://doi.org/10.3917/popu.403.0521
Notes
-
[*]
Institut de Démographie, UCL, Louvain-la-Neuve, Belgium. Translated by Mireille Rabenoro.
-
[1]
Fifty countries if we include two overseas territories–Reunion for France and St. Helena for Britain.
-
[2]
Among others, see D. Tabutin (1988) and Foote et al. (1996) on the various components of African demography, R. Lesthaeghe (1989) on reproductive models, E. van de Walle and D. Foster (1990), T. Locoh and V. Hertrich (1994) on fertility, E. van de Walle et al. (1992) on mortality, C. Bledsoe and G. Pison (1994) on nuptiality, J. Coussy and J. Vallin (1996) on the consequences of crises for demographic and social dynamics, J. Vallin (1994) on AIDS. Let us mention the Union for African Population Study (UEPA/UAPS) that was created in 1984. It publishes a journal, African Population Studies, and has organized large conferences on African demography (Dakar 1988, Durban 1999, Tunis 2003).
-
[3]
The different development indicators by country are shown in Tables A.13 and A.14 of the Appendix.
-
[4]
With more than 90% coverage of births and deaths (United Nations definition).
-
[5]
The picture should be qualified, however, for the decade of the 1990s in many countries because of the turnover among the staff of statistical institutes, and the slackening in the level of national and international funding for data collection and analysis.
-
[6]
C. Coquery-Vidrovitch (1988) reaches that estimate by distinguishing between the trade through the Sahara to the Mediterranean world (starting in Antiquity, this was the most long-lasting, and concerned approximately 9 million persons, in large part after the 15th century), the Atlantic trade (more concentrated in time, between 1450 and 1900, 12 million individuals) and the trade to the Indian Ocean (5 million persons).
-
[7]
The highest rate was observed in Kenya (3.8%).
-
[8]
Not to mention small islands such as the Comoros (315 inhabitants per sq. km.), Mauritius (581) or Reunion (288).
-
[9]
Also see United Nations (1990), E. Van de Walle (1996) and R. Lesthaeghe et al. (1989).
-
[10]
A man may be 15 to 20 years older than his second or third wife (Donadjé, 1992). A wide age difference between spouses is the demographic condition for the polygynous system to work.
-
[11]
The proportions of widowed or divorced people at any given time (as observed in a census or a survey) does not provide a reliable indicator as remarriage is frequent and rapid.
-
[12]
The basic data by country are presented in Table A.5 of the Appendix.
-
[13]
Except for a few countries that were then severely affected by sterility, particularly Gabon and the Central African Republic, or regions such as the northern part of the DR Congo or of Cameroon (Evina, 1994 ; Larsen, 1994).
-
[14]
Partly only, as prenuptial conceptions or extramarital births are quite common in many countries.
-
[15]
A proportion that also depends on the total level of fertility.
-
[16]
Data derived from comparable DHSs conducted close to 1988 and 1998.
-
[17]
Except for a few countries such as Niger or Chad.
-
[18]
See among others, D. Tabutin (1997) on 30 countries around 1990, and D. Tabutin and B. Schoumaker (2001) concerning 161 regions of sub-Saharan Africa.
-
[19]
Which combines life expectancy, per capita GDP and education.
-
[20]
Correlations with other variables such as urbanization level, the proportion of non-agricultural workers or educational level are lower.
-
[21]
For example, with a child mortality rate of 100‰, fertility in the countries ranges from 4 to 7 children ; with a development index of 0.400, it also ranges from 4 to 7.
-
[22]
With little difference between the sub-regions : 34.2 months in West Africa, 31.9 months in Central Africa and 33.0 in East Africa (our own calculations based on Table A.6 of the Appendix).
-
[23]
Only Cape Verde and Gabon had “low” durations, though these were about one year long.
-
[24]
This is defined as the period during which a woman is virtually free from any risk of becoming pregnant, as a result of amenorrhoea and/or sexual abstinence.
-
[25]
On this point see for example the study by C. Jolly and J. Gribble (1996) in which Bongaarts’ model was applied to 12 countries in the early 1990s.
-
[26]
Mauritius and Reunion should be added to the list, and maybe Botswana, which was not included in Table A.7 for lack of recent data.
-
[27]
In virtually all countries, from 80 to 95% of married women know at least one modern method.
-
[28]
Compared with the other intermediate variables (breastfeeding, abstinence, age at first marriage), it was also, and by far, the variable most closely associated with fertility (R2=0.56) in the study by D. Tabutin and B. Schoumaker (2001) on 161 regions in Africa.
-
[29]
Those estimates are usually based on child mortality (which is comparatively well documented) ; Coale and Demeny’s model life tables are used for extrapolation to other ages. The estimates also incorporate AIDS-related risks in those countries most severely affected (for further details, see United Nations, 2002c). In view of the low level of reliability of these estimates, we do not present separate estimates for males and females in the different countries. We will do so, however, for children.
-
[30]
Botswana, where life expectancy (65 years) ranked among the highest in Africa in 1990, has regressed to 60 years earlier in its history and has a current mortality level identical to that of the 1940s.
-
[31]
See F. Meslé (2003) for a similar approach.
-
[32]
These figures correspond to the middle point in the range of plus or minus 15% for the UNAIDS estimates.
-
[33]
The impact of HIV/AIDS on fertility is less well known, but it would appear that the fertility of HIV-positive women is lower by about 25 to 40% than that of non-infected women. The differences might be explained largely by the effects of other sexually transmissible diseases associated with the HIV infection (United Nations, 2002a). The indirect influences of the AIDS epidemic over fertility, particularly through a change in the behaviour of non-infected individuals, are potentially important, though still poorly documented (United Nations, 2002a).
-
[34]
This is why the World Health Organization presents estimates for any country with a wide confidence interval, of which we chose to use the central value (WHO, 2003).
-
[35]
Some caution is required concerning data on the past. But child mortality is now comparatively well measured, particularly thanks to the DHS, though it is probably slightly underestimated in that source.
-
[36]
South America was in a better position already then.
-
[37]
Not to mention Mauritius and Reunion, where infant mortality rates are 16 and 8‰ respectively.
-
[38]
As a matter of fact, one of its components (life expectancy) depends directly on the child mortality level.
-
[39]
Each DHS gives three relatively reliable estimates over the 0-4, 5-9 and 10-14 year periods preceding the survey. By combining two surveys conducted in a country at six- to eight-year intervals, it is possible to cover 20 to 25 years in the history of the mortality of children. There may be omissions or inconsistencies in those retrospective observations (interviews of mothers on the survival of the children born 5, 10 or 15 years ago), but on the whole they are not bad.
-
[40]
The proportion of births without any antenatal visit was left out because it varies too much from one country to another within a sub-region for any average to be calculated (Table A.9 in the Appendix).
-
[41]
With the help of traditional midwives, female relatives or friends, and sometimes with no assistance at all.
-
[42]
Though mortality rates among boys should be higher by 5 to 10%.
-
[43]
Conversely, with 5.8 % at 60 and over, the proportion of elderly people is only slightly higher in Southern Africa. Aging from the top will increase markedly from 2010 onwards.
-
[44]
The indicators used here are those used by the United Nations, based on national definitions which are not homogeneous. Urbanization levels and trends are therefore not perfectly comparable, neither between countries nor in time.
-
[45]
However, the level is the same as in East and Southeast Asia.
-
[46]
The proportion of the urban population concentrated in large African cities, however, is smaller than in other regions of the world, and urban Africa is still predominantly made up of small and medium-sized cities (Chen et al., 1998). In 2000, only 28.5% of the urban population of the continent were living in cities with over 1 million inhabitants, as against 42.2% in Latin America and the Caribbean (United Nations, 2002d).
-
[47]
Though there will certainly be differences between the regions and countries of Africa.
-
[48]
Migrants include individuals born abroad, plus refugees (United Nations, 2002b).
-
[49]
Except for data obtained through specific collection operations, such as the REMUAO surveys in seven West African countries in the early 1990s (CERPOD, 1995).
-
[50]
The reliability of data on migrant stocks is also affected by several factors. Thus, in certain countries, migrant stocks are estimated on the basis of a question on nationality rather than place of birth. Moreover, refugees may be counted twice in certain cases, because they are sometimes included among migrants in census data (Zlotnik, 2003).
-
[51]
However, it is definitely lower than in developed countries, where international immigrants numbered almost 9% around 2000.
-
[52]
International immigrants are defined as individuals who were born in a different country than their country of residence. They may be citizens of other countries, as is the case for most immigrants in Côte d’Ivoire, but they may also be citizens of the country who were born abroad, as is probably the case for a large proportion of the immigrants in Burkina Faso.
-
[53]
The deterioration of the economic situation in Côte d’Ivoire since the 1980s, however, has caused significant changes in the migration flows to and from Côte d’Ivoire, resulting even in a negative flow with Burkina Faso in the late 1980s (Bocquier, 1996). The conflict that broke out in Côte d’Ivoire in 2002 also caused many migrants to return to their country of origin.
-
[54]
For a presentation of the statistics on migration from the developing to the developed countries, see H. Zlotnik (1996). Asylum seekers are not included in such statistics.
-
[55]
Migrants from sub-Saharan Africa represent only a small proportion of all migrants to the developed countries (3.7% in 1985-89) and of the migrants from developing to developed countries (about 10%) (Zlotnik, 1993).
-
[56]
Unfortunately no similar data are available for the 1990s.
-
[57]
The numbers of immigrants reported in Table 17 are classified by year of admission as regular residents, not of arrival in France. Some immigrants, particularly asylum seekers and individuals whose position was subsequently regularized, may have come to France before they were admitted as regular residents. This may account for the large increase in the number of Malians in 1998, as a result of the 1997-1998 regularization campaign. For further details on the method used for counting immigrants, see X. Thierry (2001).
-
[58]
After other variables such as type of residence, religion, ethnic group or economic activity, among others, have been statistically controlled.
-
[59]
In view of the low reliability of information on education, we have chosen not to present the data on secondary and higher education.
-
[60]
Those (non-weighted) average figures were calculated on the basis of the data by country in Table A.14 of the Appendix.
-
[61]
Calculated on the basis of data in Table A.14 of the Appendix, average school enrollment rates for the entire region are 68% for boys and 61% for girls.
-
[62]
For abundant further information, see the ten papers of the “Continuing inequality in education” panel during the colloquium on “Gender, Population and Development” held in Abidjan in July 2001. In particular, see the historical synthesis paper by M.-F. Lange and the paper by R. Clignet and M. Pilon on the methodology for measuring inequality (http :// www. ined. fr/ rencontres/ colloques/ coll_abidjan/ genre/ colgens6. htm).
1Sub-Saharan Africa (48 states, 50 countries [1], 700 million people in 2004, and close to 22 million sq. km.) was long considered by demographers to be a relatively homogeneous region that withstood the socio-demographic changes that had been occurring in a large part of the world since the 1950s or the 1960s. During the 1970s, African demography or the population of Tropical Africa was characterized overall by early and universal marriage, high fertility and excessive mortality, and finally rapid growth. Since then, however, the situation has changed, and Africa is no longer an exception. For the most part, it has entered the demographic transition process.
2But just as elsewhere two or three decades ago, the changes are occurring at various paces according to the country, depending on the (numerous) cultural systems, the diversified economies, the political systems, but also on the crises of various kinds that some countries, or even entire sub-regions of the continent, have been experiencing over the last 30 years : conflicts and civil wars, food shortages that sometimes attain the famine stage, a deterioration of living standards, and of course aids. Vulnerability, insecurity and poverty are the fate of many countries, and of large strata of the population within each of them.
3In the 1990s the demography of Africa and its sub-regions and countries became the subject of several general surveys. These were mostly collective works with a focus either on all the components of demographic change, or more often on one or the other issue, such as fertility or AIDS [2]. The present chronicle, which is by definition less ambitious, has two objectives. The first is to present data that are as comparable, reliable and recent as possible on the evolution since 1950, and the present characteristics of the population of each country. These data are gathered in a statistical appendix in 14 large tables that correspond to each of the issues addressed in the text. The second objective is to achieve a synthetic view of the major components of change and of the growing diversification of the situations in the region. The information is summarized in graphs and smaller tables. This chronicle focuses on sub-Saharan Africa, and excludes the five countries of North Africa, which have a different history, culture and demography. Together with the Middle East, North Africa will be the subject of a future chronicle.
4We begin with a few words comparing the African social and economic context with that of other regions, a review of the progress achieved in the area of information systems and an overview of the evolution of the population over two millennia. Next we consider successively : 1) the size and growth of the populations since 1950 ; 2) the sub-regional patterns of demographic transition ; 3) nuptiality (age at first marriage, polygyny, marriage dissolution) ; 4) fertility (levels, trends) and its proximate determinants (e.g. breastfeeding, abstinence, contraception) ; 5) overall mortality, maternal mortality and AIDS ; 6) child mortality (from age 0 to 5) and health (vaccination, malnutrition, medical services) ; 7) the age structure ; 8) urbanization and the rural exodus ; 9) international migration within Africa as well as to the wealthy countries ; and 10) inequality between men and women in education.
5Our approach is essentially descriptive, and involves the study of levels and trends in all countries and sub-regions, the discussion of inequality (in terms of education and type of residence) in countries at different stages in the transition or the process of development (particularly Benin, Nigeria, Mali, Cameroon, Kenya and Zimbabwe). Occasionally we will study the relation between the countries’ demographic indices and various indicators of social, economic, human and health development, which are regrouped by country in Tables A.13 and A.14 of the Appendix.
6The preferred sources of data include, on the one hand, the data banks of various United Nations agencies (the Population Division, UNDP, WHO, UNESCO, etc.), which are essential for reconstructing the major changes since 1950 or for identifying specific indicators, and on the other hand, the Demographic and Health Surveys (DHS) or similar surveys. A total of 81 surveys have been conducted since 1984, including 47 since 1994 in 30 African countries. We will also use, with some additions, a few recent studies such as those of V. Hertrich (2001) on age at marriage or of X. Thierry (2001) on immigration in France.
7Two of the 50 countries included in sub-Saharan Africa — the Seychelles (453 sq. km. and 80,000 people) and St. Helena (410 sq. km. and 7,500 people) — have been left out of this chronicle because they are very small and poorly documented. The remaining 48 countries are regrouped in the statistical appendix into the commonly accepted four sub-regions : West Africa (16 countries), Central Africa (9 countries), East Africa (18 countries) and Southern Africa (5 countries). The map below shows the geographical location of the countries and their grouping into sub-regions.
I – Africa in the world : general and historical background
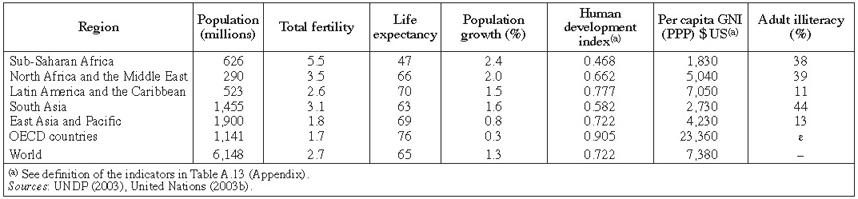
8Globally, sub-Saharan Africa (Table 1) still registers the most rapid demographic growth in the world (2.4% in 2001 as against between 0.8 and 2% in the other developing regions), very high fertility (5.5 children per woman as against between 1.8 and 3.5 elsewhere) and high mortality rates (life expectancy of 47 as against at least 63 everywhere else). Currently it represents 10% of the world population and 13% of that of the so-called developing regions.
Some socio-demographic characteristics of sub-Saharan Africa and of the other major world regions in 2001
Some socio-demographic characteristics of sub-Saharan Africa and of the other major world regions in 2001
9Overall, the region is also — and by far — the most disadvantaged region in the world from an economic and social point of view. Its income per inhabitant, in terms of purchasing power parity, in 2001 ($1,830) is lower by one third than in South Asia, and about three times lower than that of North Africa and the Middle East. In terms of human development (HDI), the region is clearly behind South Asia and ranks very far back behind Latin America or East Asia. In the UNDP world ranking (2003), 34 out of the 40 poorest countries belong to sub-Saharan Africa [3]. Similarly, in the ranking by degree of poverty, most African countries are among the poorest. Only adult illiteracy (38%) is not worse on the whole than in North Africa (39%) or South Asia (44%). Behind all this, however, are substantial inequalities between countries within the continent (Table A.13 of the Appendix).
10Another characteristic of the region is a result of its history, with a colonial period that was much longer than elsewhere. Except for Liberia (created by the United States in 1847) and Ethiopia, most African countries were occupied, and colonized under one form or another from the 1880s onward. Four European countries partitioned sub-Saharan Africa among themselves. France, besides Madagascar, the Comoros and Djibouti, was present in West and Central Africa (18 of the countries existing today). Great Britain (17 countries) occupied a few countries in West Africa (including Nigeria), but mostly in East Africa (Kenya, Malawi, Uganda) and Southern Africa. Belgium colonized three countries (the present-day Democratic Republic of the Congo, Rwanda and Burundi), and Portugal five countries including Mozambique and Angola. Let us not forget Germany which occupied Togo, parts of Cameroon, Tanganyika and Namibia until 1918, and Spain with Equatorial Guinea.

11Except for South Africa, which became independent in 1910, all those countries experienced colonial occupation for 70 to 90 years before becoming independent at various dates (Table A.2 of the Appendix). In 1960 France withdrew from most of its colonies, as Belgium did from the DR Congo, and Great Britain from Nigeria. By 1967 most of the countries were liberated, except for the Portuguese colonies that gained independence only in 1974 and 1975, Zimbabwe that was occupied by the British until 1980, the Comoros and Djibouti that got their independence in 1975 and 1977, and Namibia that remained under South African mandate until 1990. Reunion Island became a French overseas département (DOM) in 1946.
II – Important recent progress in data collection
12Until the late 1960s, Africa was in general suffering from an obvious shortage of socio-demographic data, though variable situations prevailed. Some (rather rudimentary) censuses were conducted in the countries under British or Portuguese domination, and a few household surveys in the countries under French or Belgian domination. Vital registration systems mostly functioned poorly or not at all, both in recording events or in processing the data. Even today, 40 years later, it only works correctly [4]in a few small countries such as Cape Verde, Mauritius, Reunion, Sao Tome and Principe and the Seychelles, in South Africa, or simply in the capitals (Gendreau, 1993).
13On the other hand, the situation improved considerably from the 1970s onward in the area of censuses and surveys, with the development of statistical institutes, the training of statisticians and demographers, substantial external financial support for data collection operations and the launching of large international projects such as the World Fertility Survey (WFS) programme between 1974 and 1982, or the Demographic and Health Surveys (DHS) sponsored by the United States since 1984 [5].
14As a result (Table 2) more and more national demographic operations have been conducted in the 48 countries of the region since 1970, and most of all since 1980 : on the average, practically one census and one survey every ten years. National situations, however, vary considerably (Table A.1 of the Appendix), ranging from well documented countries with 3 to 5 censuses and 5 to 8 surveys (Kenya, Ghana, Burkina Faso, Senegal, Cameroon, Zambia) to countries that are statistically very neglected (DR Congo, Congo, Guinea, Gabon, Chad, Somalia, Swaziland). Among the 48 countries, 45 have conducted at least one census since 1994, and 30 at least one DHS. It is mostly thanks to the latter that we know the characteristics of fertility, mortality, and maternal and child mortality and health in many African countries.
Number of censuses and national demographic surveys since 1960 in all 48 countries

Number of censuses and national demographic surveys since 1960 in all 48 countries
III – An eventful demographic history in the last two millennia
15The evolution of the settlement of Africa since Antiquity is still poorly known and difficult to investigate. As a result, it is not surprising that population estimates for the remote past may vary from one author to another (Table 3) : 21 to 30 million inhabitants around the year 1000, 48 to 78 million around 1500, 83 to 92 in 1800. For the nineteenth and the twentieth centuries, estimates converge : 95 to 101 million around 1900. Historians agree, however, on the important role of climatic factors and their consequences (drought, food shortage, famine, epidemics) in the past, and on the tragic impact of the slave trade on the demographic and social dynamics of the societies involved. Between the fifteenth century and the end of the twentieth, about 25 million persons may have been affected [6].
Growth of the population of sub-Saharan Africa since the beginning of our era

Growth of the population of sub-Saharan Africa since the beginning of our era
16Between 1700 to 1900, unlike other regions in the world where the population grew two- or threefold, the population of sub-Saharan Africa stagnated according to J.-N. Biraben (2003), or increased only slightly according to D. Cordell (2001). Its proportion of the world’s population, which had been increasing since Antiquity, declined steadily from the sixteenth century (17%) to the end of the nineteenth century (6%). The demographic growth of the continent generally remained slow until the twentieth century (between 0.13 and 0.21% a year, depending on the period). Historians are unanimous that the period of intense colonization (1880-1920) was even a phase when demographic growth slowed down or sometimes regressed sharply in certain regions (forced labour, displacement of population, importation of diseases, etc.). Only in the 1920s did Africa witness a sharp resumption of its population dynamics.
IV – Population and growth since 1950 : rapid increase and diversification
17In the second half of the 20th century the population of sub-Saharan Africa grew very fast, and even at an increasing pace between 1950 and 1985, with gradual diversification among countries because of the different pace of fertility decline, but also because of AIDS in the most affected countries or sub-regions.
1 – The highest growth rates in the world in the last 50 years
18Unlike other regions in the world, Africa experienced a steady increase of its population growth between 1950 (2.2%) and 1985 (2.8%), as a result of sustained high fertility and declining mortality. Except for South Africa, where growth remained around 2.4%, and the islands of Reunion and Mauritius, where fertility declined as early as the 1960s, the growth rate went up by 1 percentage point in most of the countries over the period (Table A.3 of the Appendix), to reach close to 3% [7] overall around 1985. With these rates, the population of virtually all of them tripled in 35 to 40 years, and the total population of sub-Saharan Africa grew from 177 million in 1950 to 504 million in 1990 (Table A.2 of the Appendix).
19Since 1990, the whole of sub-Saharan Africa has entered a phase of demographic slowdown, with the growth rate declining from 2.9% a year circa 1985 to 2.3% in 2000. But the slowdown is occurring at various or even divergent paces among the countries (Figure 1). At one extreme, in close to twenty countries from different sub-regions, growth rates have not changed, or have even slightly increased since 1985 (e.g. Niger, Mali, Mozambique, Somalia). At the other extreme, in five Southern African countries plus Zimbabwe and Zambia, growth rates have practically collapsed from 1995 onward, as a result of excess mortality due to AIDS (the topic will be discussed again later). For example, South Africa and Botswana’s growth rates declined from 2.0 and 2.8% respectively in 1990-94, to 0.6 and 0.9% ten years later. This is a unique event in history.
Change in population growth rates from 1980-84 to 2000-04 in 48 countries

Change in population growth rates from 1980-84 to 2000-04 in 48 countries
20Between those extremes, some 25 countries undergo a decline of growth rates, but at different paces (Figure 1) : rather slow in West and Central Africa, slightly more rapid (on average) in East Africa. And there is no clear relation between the pace of decline and the initial level in 1980-84. Finally, between 1990 and 2005, the populations of the various sub-regions and of most of the countries increased by approximately 50%, except in Southern Africa (24%).
2 – Some projections to 2040
21The growth rates are slowing down, or will do so soon, but as they are still very high overall, they will induce significant further increases in the population over the next three or four decades (Table A.2 of the Appendix). The entire region will then rise from 732 million people in 2005 to 992 million in 2020, and to 1,374 million in 2040 according to the medium variant of the United Nations projections (2003b). Three of the four sub-regions, as well as a large majority of the countries, will probably see their population double in 40 years, and in some countries (e.g. Niger, Mali, Burkina Faso) it will increase almost threefold. Even in the countries that are most advanced in the fertility transition today (Ghana, Côte d’Ivoire, Kenya for example), the increase will still amount to 40 to 50%.
22Southern Africa presents a different picture. Still according to the United Nations projections, the growth rates, which have recently collapsed, will soon turn negative and will remain so until 2040 (approximately – 0.30% between 2010 and 2040). The population will significantly decline : between 2005 and 2040, the region will decrease from 52 million people to 47 million, thus recovering its size of 1995. South Africa and Swaziland will lose 10% of their population, and Botswana 19%. The effects of AIDS, as we shall see below, will also cause age structures to be drastically destabilized.
3 – Population density is a relative concept
23Africa, with its fifty countries and their extremely unequal land areas, has for a long time been considered under-populated, and believed to possess huge unoccupied or unexploited areas. True to say, Africa is very unevenly settled, with national population densities currently ranging from less than 10 inhabitants per sq. km. (e.g. Niger, Mauritania, Central African Republic, Gabon, Namibia) to close to 250 in Rwanda and even almost 300 in Burundi [8], for a sub-Saharan average of 27 (Table A.2 of the Appendix).
24These national densities, however, conceal huge inequalities within the countries. In Benin, for example, the Atlantic coastal district where the capital and most economic activities are located accounts for 25% of the population and 3% of the national territory ; rural densities, moreover, range between 10 and 300 inhabitants per sq. km. depending on the region. In Kenya, 90% of the people live on 20% of the land. In Burundi, certain rural communes exceed over 350 inhabitants per sq. km., and some hills exceed 700.
25On the other hand, if calculated in the classic manner (number of inhabitants divided by the total land area), those densities are poor indicators of the relation between population pressure and agricultural resources (Mathieu and Tabutin, 1996). By recalculating the densities, as we did, based on the surfaces of arable land and permanent crops (Table A.2 of the Appendix), the perspective changes completely. For example, densities rise in Mauritania from 3 to 529 inhabitants per sq. km., in Senegal from 48 to 391, in Kenya from 53 to 676, in Somalia from 14 to 817. Africa thus appears to be far from under-populated, in terms of farmed or cultivable land.
V – Four main situations or transition patterns
26On the whole, sub-Saharan Africa has undoubtedly entered the global process of demographic transition, with a preliminary decline of mortality as early as the 1950s and 1960s, followed in recent times by the beginning of a decline in fertility. Only a minority of countries, however, are conforming smoothly, without breaks or reversals, to the usual pattern.
Four standard patterns of transition in sub-Saharan Africa between 1950 and 2005

Four standard patterns of transition in sub-Saharan Africa between 1950 and 2005
- The traditional pattern illustrated by Mali, where mortality has declined but birth rates are still at very high levels (45 to 50‰). A dozen countries among the poorest belong to this category, from West Africa (Niger, Burkina Faso, Guinea), Central Africa (Angola, Congo, Chad) or East Africa (Uganda, Somalia).
- The classic pattern of change, illustrated by Ghana, where mortality has declined steadily for the last 50 years, birth rates have decreased for the last 20 years, and growth, though still rapid, is slowing down. Ten countries conform to the model, including Senegal, Gambia, Gabon, Sao Tome and Principe, the Comoros, Sudan and Eritrea.
- The AIDS-perturbed pattern, illustrated by Zimbabwe : fertility and mortality were declining normally until about 1990, but the process was brutally interrupted by significant resumption of mortality, leading sometimes, as mentioned above, to a drastic reduction of growth. This model is to be found in the 5 countries in Southern Africa, a number of countries in East Africa (Kenya, Malawi, Tanzania, Zambia), in Côte d’Ivoire, Cameroon and the Central African Republic.
- The war-perturbed model, illustrated by Liberia, with brutal resumption of mortality due to the conflicts, but also to the resulting impoverishment and sometimes to AIDS. The model applies to Sierra Leone, probably the DR Congo, Burundi and most of all Rwanda (with the 1994 genocide).
28We shall now examine the levels and trends of nuptiality, fertility, mortality and migration, on which those past or recent demographic dynamics depend directly.
VI – Nuptiality : change and continuity
29In the theory of the demographic transition, just as in most countries in the last 30 years, changes in nuptiality and particularly in age at first marriage precede changes in birth control within marriage. The age of entry into union, permanent celibacy and divorce figure among the immediate determinants of overall fertility.
30Traditional African nuptiality regimes were generally characterized by very early entry into a union for women and at a much later age for men, by the widest age differences between the sexes in the world, by the rejection of celibacy, by frequent remarriage of widowed and divorced women, and by the practice of polygyny that was ubiquitous and often frequent (Hertrich, 2001) [9]. What is the current situation ? Table A.4 of the Appendix presents male and female median ages at marriage in 48 countries in the late 1970s and 1990s, the age differences between spouses at those two dates, and the current situation of the proportions never married and of polygyny. The data are summarized by sub-region in Table 4.
Women’s median age at first marriage, age difference between spouses and proportion of polygynous women aged 35-44, by sub-region

Women’s median age at first marriage, age difference between spouses and proportion of polygynous women aged 35-44, by sub-region
1 – General increase in the age at marriage
31In most countries, the median age at first marriage of women is going up, approximately from 18-19 in the late 1970s to 19-20 in the late 1990s, with frequent gains of the order of 1 to 1.5 years. Only a few countries retain an early marriage model today : Niger (16.8 years), Chad (17.7), Uganda (17.5) and Mozambique (17.8). At the other extreme, the countries of Southern Africa and Reunion, which had a late marriage pattern as early as the 1970s, now have an age at first marriage of the order of 28. In between, a majority of countries have an average age around 20 (Figure 3). In short, sub-Saharan Africa has not experienced a marriage revolution comparable to that in North Africa over 25 years, but changes did occur.
Median ages at first marriage of women and men in the late 1990s (36 countries)

Median ages at first marriage of women and men in the late 1990s (36 countries)
32Among men, the ages of entry into union, which were relatively late already in the 1970s, are often also rising, but less so than among women. In a majority of countries, they are now around 25 or 26, except in Southern Africa and Reunion, where they attain 31 (Table A.4).
33As a consequence, age differences at first marriage between men and women, which were very wide in the 1960s and 1970s (usually 6 to 7 years), are now narrowing slightly, though they remain important in a majority of countries (Figure 3).
2 – Marriage remains the rule
34Getting married remains the largely predominant social norm in Africa, for women as well as for men. Except once more for the countries of Southern Africa, where the proportion never married is no longer negligible (about 14% of women at age 45), virtually all men and women eventually contract a union. In 40 countries, the proportion of men who remain single seldom exceeds 4%, and of women 2%. There is, however, a trend in the African capitals or large cities towards extended single life, which may eventually lead to a rise in the proportion never marrying (Antoine, 2003).
3 – A good resistance of polygyny
35Sub-Saharan Africa has always been a fertile ground for this type of marriage, which is one of the essential pillars of family structures in the region. In the 1960s and 1970s its decline or even its demise was predicted, as a result of westernisation, education and socio-economic development, and in more recent times, under the impact of “the crisis”. The most recent data from censuses or surveys show that far from disappearing, polygyny withstands the various contextual changes well.
36However, its prevalence, which is high on average, was and is variable between sub-regions of the continent, between countries within sub-regions, or between ethnic groups and living environments within countries (Sala Diakanda, 1980 ; Klissou, 1995). Polygyny has always been most widespread, and by far, in West Africa and the Sahel (Table 4), with currently 30% to 60% of women aged 35 to 44 living in polygynous marriage, with the exception of Mauritania (Table A.4 of the Appendix). It is only slightly less widespread in Central Africa, but markedly less important and more variable in the 17 East African countries (ranging from 4% in Madagascar to 39% in Uganda), and most of all in Southern Africa (14%).
37However, the beginning of a trend towards widespread decline of polygyny has been observed almost everywhere in recent times, though it mainly affects the cities and the most privileged or educated social classes. For the time being, one out of every three African women aged 40 is in a polygynous marriage (Table 4) ; almost one out of two may still be involved in that regime at one time or another.
4 – Divorce and remarriage are important, but poorly documented
38Polygyny, but also divorce and widowhood remain the major marital “hazards” for an African woman, because of the instability of marriage (quarrels between man and wife, arranged marriages, wife’s infertility) and the age difference between the spouses, which is sometimes quite substantial, particularly in polygynous unions [10]. Frequency and timing of divorce, widowhood and remarriage are among the least well documented facts in African demography, as they require the full marital history of men and women. These are available in the few WFS conducted in the 1970s, but not in the numerous recent DHS [11]. It is therefore difficult to measure changes.
39The few studies of divorce conducted in the 1970s and the 1980s have all demonstrated the importance of the phenomenon as well as its diversity over space. According to R. Lesthaeghe et al. (1989), divorce, generally followed soon after by remarriage, was more frequent in West Africa (45% to 53% of unions dissolved in the different countries) than in East Africa (29% to 34%). Although there are few recent studies, those that are available on West Africa have confirmed the phenomenon’s importance. After 30 years of marriage, 35% of women’s first marriages in Ghana, 38% in Togo, 29% in Mauritania are dissolved by divorce ; in Dakar, one out of every three marriages ends in divorce (Antoine and Dial, 2003). In Burkina Faso (Thiombiano, 2004), a mostly rural country, divorce at the national level is less frequent than elsewhere (16% after 30 years of marriage), but it affects one out of every five women in the cities, with increased risks for early marriages, educated women and the younger generations.
40Widowhood is obviously another major cause of marriage dissolution in Africa, in contexts where mortality is still high, particularly among men, and age differences between spouses are often important. In Burkina Faso for instance (Thiombiano, 2004), one out of every ten first marriages is dissolved by the man’s death before 20 years have elapsed, and one out of every five before 30 years have. The cumulative impact of divorce and widowhood results in particularly high probabilities of dissolution of their union for women, even before the end of their fecund life.
41To the extent that marriage remains a quasi-universal social norm in Africa, these marriage dissolutions by divorce or widowhood are often followed by remarriage, particularly when the women are still comparatively young and fecund. Again, the phenomenon varies throughout the continent, and remarriage is on the whole more frequent and rapid in West Africa than in the eastern or southern parts of the continent, with relatively marked differences between cities and countryside and among social groups.
5 – General regional marriage patterns
42Africa is culturally and ethnically very diversified, and this is true with regard to nuptiality as well as to family structures and social or gender relations. Marked differences prevail even among neighbouring countries.
43For the 1970s and the 1980s, R. Lesthaeghe et al. (1989) and V. Hertrich (2001) have distinguished between several main regional patterns of nuptiality. These include the Sahel and the western and central savannah regions, where marriage occurs at a very early age, polygyny is widespread and the age differences between spouses are large ; East Africa, where polygyny is less frequent and marriage occurs at a later age ; and Southern Africa with little polygyny, a fairly late age at marriage, and large proportions of never married individuals, in part because of labour migration.
44Approximately the same regional patterns still prevail in the late 1990s, twenty years later, with slightly different results (Table 4), but still with two extreme situations. On the one hand, West Africa, the most polygynous region in the world, has significant age differences between spouses ; on the other hand, Southern Africa has a very different pattern, with late marriage, a significant proportion of never married, little polygyny, and small age differences between spouses.
45Those significant spatial and cultural disparities in marriage patterns should be kept in mind as we examine the levels and trends of overall fertility.
VII – Fertility : progressive onset of decline at an uneven pace
46The fertility of sub-Saharan Africa as a whole has been declining in the last fifteen years. Until 1985 it had remained around 6.7 children per woman (Table A.5 of the Appendix), before going down to 6.1 in 1990-1994 and 5.4 in 2000-2004. That recent tendency toward decline is spreading, but at very different paces from one country to another, in a context equally characterized by high levels of demand for children and widening social disparities within the countries.
1 – Diversity in the pace of decline
47Figure 4, which compares the total fertility rates of all 48 countries in 1960-1964 and in 2000-2004 [12], clearly shows how different the current situation is from the homogeneity of the 1960s, when virtually all the countries had 6 to 7.5 children per woman [13]. Since then, very fast declines have been observed in Southern Africa (South Africa, Zimbabwe, Botswana), in Ghana and Kenya, and in the island-states (Mauritius, Cape Verde) and Reunion, and much slower declines in some twenty countries (where fertility has approximately decreased by one child per woman in 30 years), but also stagnation or even slight increases in about fifteen countries. The latter, where the TFR is still around 7 children per woman, are mostly located in Central and West Africa, with Niger holding the world record of fertility (8 children per woman). Fertility in Africa, which ranged from 6 to 8 children in the 1960s, currently varies from 2.6 to 8.0 among countries.
Total fertility rates (TFR) from 1960-64 to 2000-04 in 48 countries

Total fertility rates (TFR) from 1960-64 to 2000-04 in 48 countries
2 – Still a generally early onset of fertility
48Fertility in sub-Saharan Africa was traditionally characterized by an early onset. Three indicators may be used to measure the earliness in the 30 countries where at least one DHS has been conducted since 1994 (Table A.6 of the Appendix) : the median age at first birth, the proportion of adolescent girls (15 to 19 years) who had a child or were pregnant at the time of the survey, and the proportion of total fertility achieved before age 25.
49The median age at first childbirth, which is partly related to age at first union [14], is 19.7 (i.e. every other African woman has her first child before 20) for sub-Saharan Africa as a whole, with regional averages ranging from 18.9 in Central Africa to 20.9 in Southern Africa. In a majority of countries, women have their first birth in their nineteenth or twentieth year (Table 5) and only in four countries above age 21 : the Comoros, Eritrea, Namibia and Rwanda where, along with Burundi, age at first marriage has always occurred later, and extramarital conceptions are rare. Excluding a few small countries such as Mauritius, or Reunion, fertility still begins at an early age in Africa, and no important changes have occurred.
Number of countries by sub-region according to the median age at first birth and the proportion of adolescent girls (15 to 19) who have started childbearing

Number of countries by sub-region according to the median age at first birth and the proportion of adolescent girls (15 to 19) who have started childbearing
50The high level of adolescent fertility confirms this clearly. The proportion of girls aged 15-19 (with an average age of 17.5) who either have had a child or are pregnant is 25% for the whole of the region, ranging from 19% in Southern Africa to 34% in Central Africa. In a majority of countries it is over 25% (Table 5), with some Sahelian countries (Mali, Niger, Chad), and also Madagascar and Mozambique close to 40%. Countries like Ghana (14%), the Comoros (9%) and Rwanda (7%) occupy the other extreme.
51As for the proportion of total fertility achieved before 25 years [15], it is around 35% in a large majority of countries (Table A.6 in the Appendix), with Namibia (20%) at one extreme and Mozambique (40%) at the other.
52Early timing of fertility (whether in or out of wedlock) and high levels of adolescent fertility remain two major characteristics of African fertility.
3 – The demand for children is dropping but remains high
53In a vast majority of countries and societies, children are as much in demand as ever, and the large family norm is still valued, though on the whole the number of children wanted has been declining in the last fifteen years. For example, in very different contexts, the ideal family size among women aged 15-49 has declined in roughly ten years from 6.8 to 5.3 in Senegal, from 6.9 to 6.2 in Mali, from 5.3 to 4.3 in Ghana and from 4.4 to 3.8 in Kenya [16]. However, when calculated for the women aged 25-34 (in their peak reproductive years) in the 30 countries that had a DHS recently (between 1995 and 2002), it still amounts to 5.4 children for the whole of Africa. This is a large number when compared with the “ideal” 2.8 children in Asia and Latin America, and the 3.0 children in North Africa. Ideal family size of the younger women (25-34) is at the same level as current total fertility, but is definitely lower than the number of children actually born to women aged 45 (6.4 children).
54The demand for children naturally varies from one sub-region to the other (ranging from 3.9 in Southern Africa to 5.6 in West Africa) and from one country to the other. In 12 out of 30 countries (Table A.6 of the Appendix), desired fertility is still higher than actual fertility (TFR) ; in the remaining 18 countries it is either the same, or markedly lower.
55Changes are undoubtedly occurring. The demand for children is lower than it used to be, the proportion of women of a given age or parity who declare that they do not want any more children is increasing, and social and regional differentials (for example, between educational levels) are well established, in conformity with the geography of fertility. As we wrote as early as 1997 (Tabutin, 1997) :
“This reflects some ideological changes, but no radical and irreversible transformation of opinions and norms yet, such as other regions of the world have known in the last fifteen years. Rural, impoverished Africa, in particular, remains still very pro-natalist”.
4 – Social and regional diversification of reproductive patterns in the various countries
57All societies and regions of the world are going or have gone through a phase of growing regional and social disparities in their demographic history. In any dynamics of social change or of crisis, there are always social groups (or regions) that are ahead of the others, groups that are culturally more open or less resistant, groups that are economically more affected by crises or by progress, groups that are more influential than others. As a result, different models of adaptation or response to crisis and to progress are emerging ; in other words, life (or survival) strategies, in fertility as in other areas, are becoming diversified. To varying degrees in the different countries, Africa has now entered that phase of growing internal heterogeneity or inequality. And as in many other societies in the world, fertility transitions are channelled through the city, education and the social group. By way of illustration, Table 6 presents differential fertility by type of residence and by educational level in six countries now in different stages of transition.
Total fertility rates by type of residence and women’s educational level in six countries at various stages of transition

Total fertility rates by type of residence and women’s educational level in six countries at various stages of transition
58Today, the city and the countryside are distinct worlds. On the whole fertility rates in the different types of environment are no longer similar, as they used to be in the 1970s. In every country, urban fertility is noticeably lower (Shapiro and Tambashe, 2003a) [17], with between 3 and 4 children, as against 5 to 6 children in rural environments (Table 6). In the capitals and large cities in particular, fertility is markedly lower than elsewhere, the ideal family size is smaller, marriage is later and polygyny less common ; as we shall see below, breastfeeding and postpartum abstinence periods are shorter, and contraception of course is more widespread. Even in countries well advanced in the fertility transition (Ghana, Kenya and Zimbabwe in Table 6), the capital and the rural world still differ by 1 to 2 children.
59Similarly, education is playing an increasingly important role everywhere, as in other regions of the world. Except for a very few countries that are in a pre-transition phase (Niger, Chad or Mali), primary education is sufficient to change norms and behaviour significantly, though for the time being it is mostly access to secondary (and higher) education that induces a sharp fall in fertility (to around 3 children in many countries). Education, as we shall see, fundamentally changes the role of intermediate variables such as breastfeeding, abstinence and contraception.
60Similarly, almost everywhere regional diversity in fertility is increasing in the countries, as a consequence of frequent serious inequalities in cultural, economic, educational or health development. For example, excluding the capital regions, fertility currently ranges, in the different regions, from 5.0 to 6.9 children per woman in Benin, from 4.4 to 6.6 in Cameroon and from 3.7 to 5.7 in Kenya. The comparative spatial homogeneity observed during the 1970s and the 1980s is definitely a thing of the past.
5 – Human development and child mortality : close correlates of fertility
61Various studies on the early 1990s [18] have shown a close relationship in Africa between the fertility of a country and its human development index [19], as well as between fertility and child mortality [20]. Those synchronic relations around 2002 are presented in Figures 5 and 6, based on the United Nations’ most recent estimates of fertility and infant mortality in all 48 African countries (Tables A.5 and A.8 of the Appendix).
Relationship between the total fertility rate and the human development index in 48 countries around 2002

Relationship between the total fertility rate and the human development index in 48 countries around 2002
Relationship between the total fertility rate and infant mortality in 48 countries around 2002

Relationship between the total fertility rate and infant mortality in 48 countries around 2002
62There have been no major changes in the last ten years, and the correlations are of the same order, and significant (R2= 0.62 for human development, R2= 0.70 for infant mortality). In general, the higher a country’s human development level, the lower its fertility ; the more infant mortality is under control, the lower the fertility level. In other words, no fertility transition took place without a drop of infant mortality or without socioeconomic and health progress. In that sense, Africa seems to be conforming to the classic path of the demographic transition theory. But only the extreme situations stand out clearly. The ten poorest countries in the region all have more than 6 children per woman, whereas the six or seven most “developed” ones have between 2.2 and 3.9 children. In between, there is uncertainty and diversity [21]. In Africa as elsewhere, there will probably be multiple paths leading from high to low levels of fertility.
VIII – From breastfeeding and abstinence to contraception ?
63Perhaps more than anywhere else, the various societies and cultures of Africa agreed — and many of them still do — that live births should be reasonably spaced (with intervals neither too short nor too long) as “a rational way of ensuring the welfare of mother and baby” (van de Walle and van de Walle, 1988), though in the past limiting family size was not the aim (Page and Lesthaeghe, 1981). This birth-spacing strategy was traditionally implemented by means of prolonged breastfeeding which induced long periods of postpartum amenorrhoea, by sexual abstinence which was widely practiced, but for varying periods from one ethnic group to another, and of course by traditional (rather inefficient) contraceptive practices. What is the present situation ?
64Birth intervals, which traditionally lasted approximately three years in most African cultures, have not changed in a noticeable manner (Table A.6 of the Appendix) : except for Zimbabwe and South Africa where they are now longer (over 40 months, due to contraception for spacing), they are still about 34 months in most countries [22], ranging from 29 months in the Comoros to 38 months in Ghana.
1 – Extended breastfeeding remains universal
65On the whole, sub-Saharan Africa has retained the practice of universal and lengthy breastfeeding. All women breastfeed and most of them do so for as long as possible. In 23 out of 30 countries (Table A.7 of the Appendix) the median duration of breastfeeding exceeded 20 months in the late 1990s [23]. In South Africa and Namibia, it is still 16 and 17 months respectively. In our estimates, the African average (21 months, Table 7) is far longer than in Latin America (13 months) or North Africa (12 months).
Breastfeeding, postpartum sexual abstinence, contraception and sterility by major sub-region around 2002

Breastfeeding, postpartum sexual abstinence, contraception and sterility by major sub-region around 2002
66Comparing the results of the 1980s, 1990s or 2000s DHS, it appears that breastfeeding periods have remained virtually unchanged at the national level. However, they are usually shorter in the cities than in the countryside, and among literate than among illiterate women. This may foreshadow future changes, though not abrupt ones. Meanwhile breastfeeding still contributes largely to lengthening birth intervals.
2 – Different durations of sexual abstinence, and a declining prevalence
67Sexual abstinence among spouses after a birth has always been a common practice, but its duration varies between cultures, ethnic groups and religions. Except for Rwanda and Burundi, where they have always been very short, postpartum abstinence periods currently last between 2 and 4 months in ten countries (including the Moslem Sahel region), between 9 and 12 months in seven others, and between 19 and 22 months in Burkina Faso and Guinea (Table A.7 of the Appendix). Just as in the 1970s and 1980s, they are longer on the whole in the western and central than in the eastern and southern parts of the continent (Table 7). With an average duration of the order of 7 months, abstinence is much longer in sub-Saharan Africa than in the other developing regions, where it is between 2 and 3 months.
68Whereas breastfeeding is keeping up, abstinence is undergoing more fluctuations, with the duration decreasing in many countries during the last 15 years : it went down from 14 to 8 months in Ghana, from 7 to 2 in Mali, from 6 to 3 in Kenya, from 4 to 3 in Zimbabwe. This is probably the behaviour that is most susceptible to contextual changes. Everywhere, its duration is curtailed most in the large cities, among literate couples or in the more privileged social classes. For example, in Benin in 2001 (Table 8), though the country is poor and at the very beginning of the transition, abstinence now lasts only 5 months in Cotonou (the largest city) and 4 months among well-educated women, as against 10 months in the rural area and 13 months among the illiterate.
Age at first marriage, breastfeeding, postpartum abstinence, modern contraception and fertility in benin (2001) by type of residence and women’s educational level

Age at first marriage, breastfeeding, postpartum abstinence, modern contraception and fertility in benin (2001) by type of residence and women’s educational level
69While they are evolving, these postpartum breastfeeding and sexual abstinence practices remain markedly more intense and more widespread in Africa than in the rest of the world. They still induce long periods of postpartum non-susceptibility [24] (12 months in Kenya, between 14 and 16 months in Ghana, Mali and Benin, 19 months in Côte d’Ivoire). In a vast majority of countries, they are still the main fertility regulator in the absence of widespread contraception [25].
3 – The slow progress of modern contraception
70The situation in Africa is now different from what it was in the 1970s or 1980s, when except for a few countries (Mauritius, Cape Verde, South Africa, Zimbabwe), contraception was negligible, with prevalence ranging from 1 to 5% among married women. Since then there has been real progress, though on the whole it was slow and often limited to the large cities and the most educated or privileged social groups.
71Around 2000, modern contraceptive prevalence among married women aged 15-49 is still under 8% in 15 countries (out of the 30 in Table A.7 of the Appendix), between 8 and 15% in six countries, between 15 and 30% in five countries. Only three countries (Cape Verde, South Africa and Zimbabwe) [26] come close to or exceed 50%. Changes are occurring almost everywhere, though usually on a small scale. In 10 years, for example, contraceptive prevalence in Mali rose from 1 to 6%, in Benin from 2 to 7%, in Ghana from 5 to 13%, in Cameroon and Côte d’Ivoire from 4 to 7%.
72Except for seven or eight countries, the contraceptive revolution is still a long way off in Africa, though it has started in the large cities and the capitals. Some have only reached a contraceptive prevalence around 15% (e.g. Cotonou, Yaoundé, Abidjan, Libreville), but others verge on 25% (Ouagadougou, Dakar) or have even exceded 35% (e.g. Addis Ababa, Nairobi). Highly literate couples, who are a minority in every country, are everywhere between 30 and 50%. Although health centres do not yet diffuse contraception effectively among unmarried women, it is also gradually reaching that population, but at a different pace from one country to another.
73Nowadays it is no longer only a question of knowledge of contraceptive methods (there has been great progress in that area) [27], but at the same time a problem of demand on the part of a large majority of the population (as stated previously, the demand for children is still high among women, and still more so among men) and of availability of services (in terms of geographical or cultural accessibility as well as of quality).
74In the area of contraception, the situation in Africa differs from what is happening or has happened in Asia or Latin America in two major ways : 1) when contraception is practised in marriage, it is still mainly with a view to spacing births, more or less as a substitute for abstinence ; 2) therefore it relies on reversible methods (e.g. pill, IUD, rhythm), with very little female sterilization and no vasectomy at all. Outside of Southern Africa or Kenya, few countries practice stopping behaviour. The vast majority of African cultures still abhor sterility, sub-fecundity and early infertility. Everywhere the proportion of women who say that they do not want any more children increases substantially with age, but a wide gap still persists between stated desires, real expectations and behavioural change.
75Overall, as expected, modern contraceptive practice is negatively associated with fertility [28], even though the general level of the former is still low (13%). But the relationship is neither as clear nor as linear as in other parts of the world (Figure 7).
Relationship between total fertility rates and prevalence of modern contraception in 30 countries around 2000

Relationship between total fertility rates and prevalence of modern contraception in 30 countries around 2000
76A great variety of situations are observed. For a total fertility of 6 children, prevalence ranges from 5 to 25%. With low prevalence, national fertility rates range from 4 to 6. Countries like Ghana, Mauritania or Eritrea achieved a first fertility transition (from 6 to 4.5 children) without great diffusion of contraception. Even better, cities like Lomé, Yaoundé-Douala, Accra or Abidjan went down to 3 children with little contraception (10 to 15% only among married women), whereas others have achieved the same fertility rates with more common prevalence rates of 30 to 40%. Outside of Southern Africa or countries like Kenya, Cape Verde or Reunion, this confirms the fact that contraception plays an extremely variable and sometimes very small role as a fertility regulator.
4 – Induced abortion
77Probably even more so than in other regions of the world, abortion is a taboo subject in Africa that is little known and rarely addressed in the classic surveys. Its prevalence can only be inferred from declining fertility rates, particularly in the cities, but very few studies have been able to take it into account. According to a recent comprehensive review of the literature on Africa (Guillaume, 2003a), abortion would appear not to be only practised by young, unmarried women, but also to be a non-negligible means to control the number of children for women in unions, “more a method to space births than to limit family size”.
78On the basis of a special survey conducted in 1998 on 2,400 women in Abidjan, A. Guillaume (2003b) was able to measure the impact of abortion on fertility. In 1998 it reduced the total fertility rate (for women 15-44) by 12%, or by 0.6 children per woman. The effect on age-specific fertility rates was variable (22% at 15-19, 16% at 20-24, and 9% at 25-39). Abortion had virtually the same weight in the decline of fertility in that city between 1994 and 1999 as the postponement of first marriage and the rise of contraception.
79Resort to abortion, which is related to various economic, cultural and social reasons in the different countries, is probably on the rise in many African cities. It has — and will have — consequences not only on fertility, but also on maternal morbidity and mortality, in the absence of legalization and of adequate health structures.
IX – Overall mortality and life expectancy : contrasts and reversals
80Africa is a land of contrasts. The mortality and health of different countries recorded variable progress between 1950 and 1990. At the same time, there were reversals, setbacks and shocks, usually linked with AIDS and warfare. In a good number of countries the health transition is now arrested. We should be cautious, however, when dealing with overall mortality, as good data on mortality by sex, age and cause of death, particularly among adults, are available in very few countries. Most national figures on life expectancy since 1950 are estimates by the Population Division of the United Nations, which often are the only comparable data available [29]. Data by country are given in Table A.8 of the Appendix.
1 – Progress between 1950 and 1990
81Starting from life expectancy figures that were particularly low in the 1950s (37 years for the region as a whole), all African countries achieved significant progress during the 1960s, 1970s and 1980s, with average annual gains of about 0.30 year (Table 9). Yet, over these four decades, Africa did not catch up with other regions of the world. Even the most rapid progress achieved on the continent, in Southern Africa (an annual gain of 0.42 year) or in Botswana (0.48 year), still lagged behind that recorded in other developing regions — 0.52 in North Africa, 0.66 in East Asia, 0.56 in Southeast Asia — from levels of life expectancy that were almost as low at the outset.
Life expectancy levels in 1952, 1972, 1992 and 2002, maternal mortality and HIV prevalence around 2001 by sub-region

Life expectancy levels in 1952, 1972, 1992 and 2002, maternal mortality and HIV prevalence around 2001 by sub-region
82Obviously, the progress achieved up to the late 1980s was not uniform between countries, and this led to growing inequalities in health and mortality in the region. Around 1950, life expectancy (Table A.8 in the Appendix) ranged from 30 (Angola, Sierra Leone, the Gambia) to 51 years in Mauritius and almost 53 in Reunion. Around 1990, it ranged from less than 40 years (in war-torn countries such as Sierra Leone, Burundi, Angola) to 66 years (Cape Verde, Sao Tome and Principe), and even 70 years in Mauritius and 73.5 in Reunion, while it remained at the time between 45 and 53 years in many countries.
83Because of AIDS, wars and economic recession, these health transitions, which on the whole were already less rapid than elsewhere, slowed down or stopped abruptly during the 1990s.
2 – Stagnation and dramatic reversals since 1990
84From 1990-94 to 2000-2004, still according to United Nations estimates (Table A.8 in the Appendix), regional life expectancy stagnated in West Africa (at 50 years), went down by 3 years in Central and East Africa (43 years in 2002), and lost 15 years in Southern Africa where current life expectancy — 46 years — is the same as it was in 1955 ! Out of a total of 48 countries, 20 (including some 10 in West Africa) are still experiencing a slight decline of mortality, but more slowly than before. Life expectancy is stagnating in seven countries (e.g. Benin, Nigeria, Ethiopia), seven more have lost between 1 and 5 years of life expectancy since 1990 (e.g. Togo, Mozambique, Tanzania), five have lost between 5 and 12 years (e.g. Côte d’Ivoire, Cameroon, Kenya), and close to ten countries (mostly in Southern Africa) have lost between 12 and… 25 years [30]. The evolution can be characterized as a health crisis or even a catastrophe, but also as a paradox since the countries most severely affected are precisely the economically emerging countries of Southern Africa.
85In sum, the African countries have experienced diversified health and mortality evolutions in the last 15 years, as illustrated in Figure 8, where we distinguish between five types depending on the recent evolution of life expectancy : a) steadily progressing countries, b) recently stagnating countries, c) countries in marked regression, d) countries with complete reversal and e) war-torn countries [31].
The different health (life expectancy) transition patterns in sub-Saharan Africa from 1950 to 2005

The different health (life expectancy) transition patterns in sub-Saharan Africa from 1950 to 2005
86The irruption of AIDS in the 1980s and its rapid expansion in some countries during the 1990s is of course the cause of a number of these reversals, which were often spectacular and almost without precedent in the history of mankind. As mentioned above, about 15 countries are most severely affected. But in all the countries where mortality has stagnated in recent times, the effects of the economic crisis, of structural adjustment programmes that have disrupted the health and education sectors, and of poverty, have combined to cause a fresh upsurge of infectious diseases that had been “under control” until then (e.g. tuberculosis). There is also a group of countries (Figure 8) that in the last 15 years have been through bloody and sometimes protracted civil wars, culminating in genocide in Rwanda. All those conflicts obviously have direct, but also indirect, effects on the health and mortality of the population, through the dismantling of land tenure and agricultural systems, the slowing down or interruption of international assistance, population displacements, etc.
3 – AIDS : a general threat
87The latest overview of the situation by UNAIDS (2003) has confirmed the seriousness of the pandemic in sub-Saharan Africa. It is by far the most severely affected region in the world, with close to 27 million people living with HIV/AIDS in 2003 (out of a total of 40 million in the world), 3.2 million new cases of infection (out of a total of 5 million) and 2.3 million deaths (out of 3 million in the world) [32]. The prevalence of HIV/AIDS attains approximately 10% for the entire sub-Saharan Africa, as against less than 1% everywhere else (Table 9).
88But HIV prevalence varies considerably through the continent (Table 9), ranging at the sub-regional level from 4.5% in West Africa to almost 30% in Southern Africa. It is less than 2% in only six countries out of the 38 for which data are available (Table A.10 of the Appendix), between 2 and 10% in 20 countries, and more than 20% in seven countries, of which all the Southern African ones. A large proportion of African countries and societies are thus fully concerned by this unprecedented epidemic, which in general is far from being under control. Although HIV prevalence is decreasing in a few countries such as Uganda, where the fight against AIDS became a national priority, or in a few capitals (e.g. Addis Ababa in Ethiopia), the worst is yet to come in countries where prevalence shows no sign of levelling off (e.g. South Africa, Botswana, Lesotho) (UNAIDS, 2003).
89The major characteristics and the present or foreseeable consequences of AIDS in Africa are quite well documented. A few words will suffice for a simple summary. Unlike in developed countries, in Africa HIV transmission is mostly heterosexual, and the majority of seropositive women were in fact infected by their husband (Cohen and Reid, 1999). Mother-to-child HIV transmission during pregnancy, delivery or breastfeeding represents the other major mode of transmission of the virus in the region. Breastfeeding is responsible for about one third of the cases of vertical HIV transmission, and this risk constitutes a genuine public health issue. Prevention is quite complex, and there is no simple solution. The use of substitutes for mother’s milk also presents high nutritional and infectious risks, which may be even higher than those from HIV. The dilemma is all the more acute as the risk of transmission from an HIV-positive mother to her child is not absolute, and amounts to 20 to 40% (Desclaux and Taverne, 2000). Another characteristic of the epidemic in sub-Saharan Africa is that women are in proportion substantially more affected than men, by at least 20% (UNAIDS, 2003), because they become sexually active at a younger age, with older sexual partners, and because the risk of HIV transmission from men to women is higher than the other way around.
90The demographic consequences of AIDS have been discussed on several occasions. The most obvious consequence is the rise of mortality at adult ages (Timæus, 1999), and AIDS today is sometimes considered as the first cause of adult mortality in sub-Saharan Africa. For example, a study on Zimbabwe has shown that the probability of dying between ages 15 and 50 has increased almost threefold in 15 years, rising from close to 150‰ in the early 1980s to more than 400‰ in the late 1990s (Feeney, 2001). Child mortality, as we shall see below, rose also significantly in the more seriously concerned countries.
91The slowdown in population increase, and even the emergence of negative growth in the most severely affected countries that we mentioned, is a consequence of the increases in mortality. The slowdown, which is obvious but moderate at the level of the continent, is extremely serious in the Southern African countries. For example, the natural growth rate of Botswana is likely to be slightly negative during the 2000-2015 period, whereas it would have been about 2.2% but for AIDS. The population of Lesotho too will be decreasing slightly, whereas a 1.6% growth rate would have been observed if there had been no AIDS (United Nations, 2003b). Age structures, as we shall see in the instance of Zimbabwe, will also be disturbed by the sudden increase in mortality [33].
92Beyond its demographic effects, the AIDS epidemic naturally also has huge economic, social and health consequences. The population of working age is the most seriously affected by HIV/AIDS, and this results in a loss of human capital because of the rising mortality and a decrease in productivity among people suffering from AIDS. Health systems are also being greatly weakened by the epidemic, which absorbs a growing part of the available resources. Educational systems too are affected, particularly through the rise of mortality among teachers. Another important consequence of the epidemic is the rapid growth of the number of orphans, both in absolute and in relative terms. In Zimbabwe in 2001 there were already about 18% orphans among the under-15s, three-fourths of whom were orphaned as a result of AIDS.
4 – Maternal mortality still very high
93National maternal mortality estimates should probably be used with even greater caution than those on AIDS, in Africa as elsewhere. In the absence of data on causes of death, indirect estimations using the different possible definitions and methods of computation provide no more than plausible orders of magnitude [34]. The mortality of women during pregnancy, at delivery or in the next 42 days (in the WHO definition of maternal mortality) is very high on the whole in sub-Saharan Africa. With a regional average estimated at 870 deaths for 100,000 births (almost 1 woman for every 100 births), it is three times higher than in Southeast Asia, five times higher than in Latin America, seven times higher than in North Africa, and fifteen times higher than in East Asia (Table 9). In practical terms, 11% of the world population (sub-Saharan Africa) accounts for 47% of maternal deaths on the planet, which were estimated at 529,000 in 2000. One African woman out of 16 will incur maternal death during her reproductive life, as against one East Asian woman out of 840 and one European woman out of 2,400 (WHO, 2003). Those few figures illustrate the huge risks that mothers in Africa still run during their fecund life.
94When this is said, maternal mortality varies in Africa as do other phenomena (Table A.10 in the Appendix). It is very high on average (around 950 for 100,000 births) in West, Central and East Africa. At 310 in Southern Africa, it is still three times higher than in North Africa. Excepting Mauritius and Reunion where it is low, it ranges from 100 (Botswana) to 2,000 (Sierra Leone), with many countries between 700 and 1,200. Maternal mortality is clearly a major public health issue for the entire region. Without going into further details, maternal mortality is related both to the supply of health care (the quantity and quality of services) and to the demand of the population for antenatal care, conditions of delivery (place and type of assistance) and post-natal follow-up of mothers. It is also related to fertility (e.g. number of children, age at delivery) and to mothers’ health condition. Some of these aspects will be examined in the next section.
X – Child mortality and health : progress, problems and uncertainties
95The health and mortality of children (aged 0 to 5) still constitutes a priority and a major concern for research as well as for intervention in sub-Saharan Africa. Huge progress has been achieved since the 1950s or 1960s, but globally Africa remains by far the most disadvantaged region from every point of view in the area of infant and child health (mortality, ante- and post-natal visits, vaccination, malnutrition), and some reversals of trends have even been observed in recent times. Moreover, there are wide geographical or social disparities. The high mortality of children is still considered a serious obstacle to changes in reproductive behaviour and to the decline of fertility.
96As in the case of fertility and life expectancy, the data on the evolution by country since 1950 were drawn from United Nations estimates [35](Table A.8 of the Appendix), and the recent data on mortality by age (under 5), the conditions of delivery, vaccination coverage and malnutrition rates, are drawn from the latest DHS in 30 countries (Table A.9 of the Appendix).
1 – Substantial progress since 1950, though slower than elsewhere
97In the 1950s, in all developing countries child mortality rates were extremely high. Close to one out of every six children died before they got to be one year old, and around one out of four died before age 5. Moreover, the differences between major world regions were not large (Table 10). Sub-Saharan Africa was then virtually at the same level as North Africa, South Asia or East Asia [36]. In 50 years, there has been substantial progress, though it was achieved at different paces.
Infant mortality from 1952 to 2002 by sub-region

Infant mortality from 1952 to 2002 by sub-region
98From 1952 to 1972 infant mortality in Africa declined almost as fast as elsewhere. Between 1972 and 1992 the decline was already not as rapid, but it is mostly since the early 1990s that the signs of its slowing down or stalling have multiplied. The decline amounted to 10% between 1992 and 2002 for the whole of sub-Saharan Africa, as against approximately 25% for all other regions (Table 10). As we shall see below, there has even been a recent upsurge of mortality in some countries.
99Today, with a current infant mortality rate of the order of 95‰, Africa is far behind the other regions, where rates range from 30 to 50‰. Since mortality between ages 1 and 5 is also very high at around 75‰ (Table 11), currently one African child out of every seven dies before age 5. And yet there has been some progress, though slower than elsewhere and slower than was expected in the 1980s, and variable from one sub-region and from one country to another. Southern Africa is still well ahead (with an infant mortality rate of 52‰), but has been making no further gains since AIDS (which involves mother-to-child transmission) began to spread. At the other extreme, Central Africa, riddled with conflicts and poverty, has the highest infant mortality rates (116‰), and here too no progress is taking place. East and West Africa are still making progress, but rather slowly. Now, let us to take a closer look at the changes.
Mortality under 5 by age, conditions of delivery, vaccination and malnutrition by sub-region around 2000 (29 countries)

Mortality under 5 by age, conditions of delivery, vaccination and malnutrition by sub-region around 2000 (29 countries)
2 – Increasing heterogeneity among the countries
100Figure 9 illustrates the diversity of the situations as well as of the progress achieved during the last forty years through the comparison between infant mortality in 48 African countries in 1960-64 and in 2000-04. Geographical inequalities in infant mortality widened considerably from the 1950s to the 2000s. In 1950-54, the rates ranged already from approximately 100‰ (South Africa, Mauritius) to 240‰ (Mali, Gambia, Angola). Nowadays they range from 30‰ (Cape Verde, Sao Tome and Principe) [37]to close to 180‰ (Sierra Leone), with rates between 90 and 110‰ in many countries (Table A.8 of the Appendix). The probability of dying between 0 and 5 varies currently from around 40‰ to almost 300‰ (Niger), for a ratio of about 1 to 7.
Infant mortality between 1960-64 and 2000-04 in 48 countries

Infant mortality between 1960-64 and 2000-04 in 48 countries
101Such growing heterogeneity is a result of the diversity in the pace of progress, which incidentally has little relation to initial levels. It is related to social policies (health, education, family planning), political history, the environment, and the degree of economic development in each country. In Africa, the mortality of children is closely related to the human development index [38]. And there are neighbouring countries that on the whole have the same climatic and cultural environment, and yet experience different situations. For example, the probability of dying between 0 and 5 is 108‰ in Ghana, while it is 146‰, 181‰ and 160‰ respectively for its neighbours, Togo, Côte d’Ivoire and Benin. A set of factors contributes to this lower mortality in Ghana. Though not much richer than its three neighbours (Table A.13 of the Appendix), Ghana is one of the sub-Saharan countries ranking highest in terms of human development (8th out of 47 countries), with a comparatively high level of adult literacy (72%), a slightly more effective infant and child health policy (Table A.9 of the Appendix), a higher prevalence of modern contraception (13% as against 7% in the neighbouring countries) and a somewhat lower fertility level (4.6 children per woman in 1998, as against 5.2 to 5.6 among the others).
102In all the countries, there is great spatial and social inequality in the mortality from 0 to 1 as well as from 1 to 5, often with threefold differences between the cities and the countryside or between social groups. We shall come back to this point later.
3 – Progress slowing down and mortality going up again in recent times
103The decade of the1990s was not favourable for children in large parts of Africa. Mortality is still declining in certain countries (e.g. Senegal, Benin, Tanzania), but progress is slowing down or halted altogether in many other countries. Worse, mortality has been rising to various degrees in the last decade for about ten countries (e.g. Zambia, Zimbabwe, Uganda, Kenya, Côte d’Ivoire, Cameroon). Figure 10 illustrates the diversity of the trends. It is based on the results of the latest two DHS in six countries that are representative of that diversity — Burkina Faso, Tanzania, Ghana, Côte d’Ivoire, Cameroon and Zimbabwe — over the years 1975 to 1998 [39]. It shows the evolution of the probabilities of dying from 0 to 5 and from 1 to 5, which have always been more sensitive to “shocks” and to progress than infant mortality.
A few examples of stagnation, slowing down of progress, and recent upsurge in the mortality of children

A few examples of stagnation, slowing down of progress, and recent upsurge in the mortality of children
104Along with Malawi, Guinea, Eritrea or Ethiopia, Tanzania and Ghana (which are both included in Figure 10) have on the whole made progress in the last 25 years, even if there was a slowdown in Ghana recently at ages 1 to 5. In Burkina Faso, where there seems to be more inconsistency between the two surveys, progress has halted and mortality is stagnating, as it is also in Mali and Gabon among others. Worse, mortality is rising again in Cameroon and Côte d’Ivoire, with consistent results between the two surveys ; as in Togo, Zambia, Nigeria or Kenya, the rise affects children aged 1 to 5 most of all, who are more susceptible to infectious diseases. Finally, Zimbabwe exemplifies the negative impact of AIDS on the mortality of children, which is also observed in Zambia, Botswana and, to a lesser degree, South Africa. In sum, as of 2000 many countries find themselves once again with the infant and child mortality rates of the 1980s.
105Those different or even diverging trends between countries, which are not related to the level of health development reached in 1990, must be attributed to a set of intertwined factors whose weight varies from one country to another : AIDS, of course, particularly in those countries most heavily affected, but also the deteriorating living standards and purchasing power in many countries, the dismantling of public health systems, the universal rise in health costs, which in Cameroon (Beninguisse, 2003) for example has caused notable changes in the behaviour and practices of the population (among the poor as well as among the middle classes) in such areas as antenatal care, delivery care or vaccination.
4 – A few examples of medical failings
106To illustrate the health situation in Africa and better understand those high rates of infant and child mortality, let us examine three practices that are essential to maternal and child health : antenatal visits, assistance at delivery, and vaccination.
107Table A.9 of the Appendix presents, for 30 countries with recent DHS, the proportion of births occurring without antenatal visits, the proportion of deliveries unassisted by medical or trained personnel, the proportion of children who receive the complete set of vaccinations (BCG, DPT, polio and measles), and the proportion of children in a state of medium or severe malnutrition. In Table 11 three of these indicators are given as regional average figures [40], along with the corresponding neonatal mortality, mortality under 1, from 1 to 5, and from 0 to 5.
108The proportion of women who have at least one antenatal visit varies considerably in the region, and sometimes even between neighbouring countries — from over 92% (in Cape Verde, South Africa, Kenya, Gabon, Uganda) to less than 40% in countries of the Sahel such as Niger and Chad or in Ethiopia (the most disadvantaged country by far in terms of child health) ; between the two extreme groups, it is around 70% in many countries. Everywhere, pregnancy is best monitored, and by far, in urban environments, and among educated and economically more privileged women (or couples).
109Similarly, Africa is still very far from supplying good medical assistance at delivery : 50% of all births in the region occur in the absence of a doctor, a midwife, a nurse or the equivalent (Table 11) ; most take place at home [41]. But it comes as no surprise that here too, wide inequalities are observed between countries. Less than 16% of deliveries are unassisted in Cape Verde, Gabon and South Africa, and almost 70% in countries like Burkina Faso, Chad and Rwanda, and even 90% in Ethiopia (Table A.9 of the Appendix). Without going into the details, there is no clear relation between the extent of medical assistance and the level of neonatal mortality by country.
110The diversity of situations is equally wide in terms of vaccination— one child out of three in West Africa, only one out of four in Central Africa, every other child in East Africa and two out of three in Southern Africa had all four basic vaccinations. Chad, Ethiopia, Niger and Nigeria (where fewer than 20% of children are vaccinated) stand at one extreme, and Tanzania, Zambia and Zimbabwe at the other (over 70%). Overall, less than one African child out of two was adequately protected around 2000.
111The living conditions, low purchasing power, poverty and at times extreme destitution make Africa a region where malnutrition is frequent and widespread. The successive surveys of the last 15 years register no gains in this area. Except for the small island countries (Cape Verde, Reunion, Sao Tome and Principe) where it is very low, malnutrition affects the whole of Africa, with the proportions of (moderately or severely) malnourished children ranging from 20% in Gabon and Togo to near 50% in Ethiopia, Madagascar, Zambia and once again, Nigeria (Table A.9 of the Appendix). Even Southern Africa, the richest sub-region, is not unaffected. Considering the close relationship between malnutrition and morbidity and mortality from infectious diseases, it is not surprising that mortality levels are high at ages 1, 2 or 3.
5 – Strong social and spatial inequalities within the countries
112Despite an economic and health situation that is more precarious and difficult than elsewhere, Africa is not spared growing social and spatial disparities in the area of child health and mortality. Without dwelling on this important issue, we take only the example of Nigeria, the country with the largest population (120 million). Table 12 shows the variability of mortality and health indicators by type of residence and mothers’ level of education. As everywhere else in Africa and the world, the urban sector of Nigeria is clearly advantaged compared with the rural world, even though the situation in the cities is far from perfect. All the mortality or health indicators are definitely better there, except for child malnutrition that is almost as high in urban (42%) as in rural (47%) areas.
Mortality of children, conditions of delivery, vaccination and malnutrition in Nigeria (1999) by mothers’ educational level and type of residence

Mortality of children, conditions of delivery, vaccination and malnutrition in Nigeria (1999) by mothers’ educational level and type of residence
113Similarly, in Nigeria as elsewhere, the education of mothers (or couples) and their living standards (which are not presented here) play a considerable role in behaviour and health practices. Mortality at ages 0 to 5 varies in a ratio of one to three between extreme educational levels, and at ages 1 to 5 (which are more sensitive to health interventions) in a ratio of one to seven (Table 12). Inequalities are just as wide for the other health indicators, except again for malnutrition, which in Nigeria also severely affects the children of highly educated women (37%, a rather surprising result). Uneducated women (41% of the population), who are often in situations of poverty, are mostly excluded from the modern health system, particularly for deliveries and vaccination.
6 – Excess female child mortality in nearly one country out of two
114The differences in mortality between male and female children depend on both biological and socio-cultural factors. On the biological side, the facts are relatively clear and universal : boys are less resistant than girls from the outset, and hence more vulnerable to many infectious or congenital diseases. This causes — or should cause — excess male mortality in the early years of life. But the history of Europe as well as of the developing countries in the last 40 years has often belied that “law”. Two out of every three developing countries in the 1970s and 1980s, and still one out of two in the 1990s, experienced a clear excess mortality of little girls, particularly between 1 and 5 (Tabutin and Willems, 1995 ; United Nations, 1998). The biological and “natural” excess male child mortality has often been compensated by socially determined excess female child mortality, which is usually attributed to differences in the behaviour (e.g. attention and care) of communities, families or couples when confronted with a boy’s or a girl’s health or sickness.
115Sub-Saharan Africa was long believed to be free of that problem, which is particularly acute in North Africa, the Middle East, or South and East Asia. But more recent studies (Tabutin et al., 2001 ; United Nations, 1998), based on better statistical material, confirm that excess female child mortality is a fact in many African countries.
116On average for the continent, mortality rates are generally equal for both sexes [42] between ages 1 and 5, but this conceals very diversified situations. When there is excess mortality of girls at those ages, it is not as intense (about 7%) or widespread as in North Africa (15%), or in West and South Asia (15 to 20%), and has probably even declined between 1970-85 and 1986-98 ; yet it does still exist in half of the countries (Tabutin et al., 2001). It is geographically undetermined (as it is observed virtually everywhere, except in Southern Africa, from where it has disappeared) and bears no relation to religion (it is observed in Islamic as well as non-Islamic societies) nor to the wealth of the country or the social and health status of its population (it is found in such different countries as Mauritius and Niger). The city does not appear to be systematically more favourable to girls. As for mothers’ education, which usually has a very positive impact on the children’s mortality and health, it plays an ambiguous role in the inequalities between the sexes.
117Vaccination, which is usually carried out in the course of large campaigns, does not discriminate particularly against little girls. On the other hand, in many countries, particularly the poorest ones, girls are disadvan-taged in terms of medical visits and care when they are sick.
118Considering the heterogeneity of the situations in the region, sometimes even between neighbouring countries, the sexual inequality with regard to mortality is not explained easily, occurring as it does in societies which, however diversified, usually consider that girls as well as boys represent a potential source of prosperity for the family group or the lineage.
XI – Age structures : changes are slow except in Southern Africa
119With a median age of 17.5, 44% of its population under 15, and less than 5% of elderly, sub-Saharan Africa is by far the youngest region in the world (Table 13). The demographic causes are well known. Fertility in Africa has changed little since the 1950s and is today well above that of other regions of the globe (cf. section VII). The decline of mortality in the last decades, which occurred faster at young ages, has even contributed to a slight increase in the proportion of young people between 1950 and 2000, as the median age dropped from 18.8 to 17.5 years. As a result of a foreseeable decline of fertility, the population of Africa will grow older during the next decades. The change will occur first at the bottom of the distribution, with a reduction in the proportion of the young, and later at the top, with an increase in that of the elderly. The changes in the next few years will be moderate, however, and the population of Africa will remain young for a long time to come. According to the medium variant in the latest United Nations projections (2003b), the proportion under 15 will probably be 40% in 2020 (against 44% in 2000), the median age 19.4 (against 17.5 in 2000), and the proportion of people aged 60 and over 5.3% (as against 4.7% in 2000).
Indicators of the age and sex distribution by sub-region in 2000

Indicators of the age and sex distribution by sub-region in 2000
120As the decline of fertility is the main cause of aging, at least in contexts where fertility and mortality rates are still high, the populations most advanced in the fertility transition are also the most advanced in the aging process. Median age in Southern Africa is higher by 4 to 5 years than in the other regions of Africa, with noticeably fewer young people (35%) than elsewhere (about 45%) [43]. With less than 30% of young people and a median age of 28, Reunion and Mauritius are now older than the rest of Africa. South Africa, the only other country where median age exceeds 20, has also definitely entered the aging process. At the other extreme, five countries with very high fertility rates (Burkina Faso, Mali, Niger, Burundi, Uganda) are particularly young, with a median age lower than 16. For the rest, there is relatively little variation between countries. In 2000 in a vast majority of the countries (37 out of 48) the median age ranged from 16 to 19 (Table A.11 of the Appendix).
121Let us look more closely at the evolution of age structures from 1950 to 2000 and the prospects for 2020 in sub-Saharan Africa as a whole and in three countries at various stages of the fertility transition and variously affected by AIDS (Figure 11). The comparison of population pyramids for Africa in the years 1950 and 2000 confirms our earlier statement : the age structure of the continent has remained virtually unchanged in 50 years. On the other hand, during the next decades, the base will be narrowing slightly as a result of the projected fertility decline (the TFR is assumed to drop from 5.1 in 2000 to 3.3 in 2020). In Mali, however, where the population became a little younger between 1950 and 2000, it will only age slightly by 2020. Its median age will then be only 16 years and the proportion of young people will be 47.5% (as against 49.1% in 2000). On the model of the whole of Africa, the age structure in Cameroon hardly changed in the period 1950-2000. But more pronounced changes are likely to occur by 2020, as the fertility transition is making headway in that country (TFR of 4.6 in 2002). Finally, the base of the Zimbabwe pyramid has significantly narrowed already between 1950 and 2000, as a result of the fertility decline that started in the early 1980s. Although the decline of fertility will still be affecting the pyramid in the coming years, it will also be perturbed by a factor of a very different nature, AIDS.
Population pyramids in 1950, 2000 and 2020 for sub-Saharan Africa and three individual countries


Population pyramids in 1950, 2000 and 2020 for sub-Saharan Africa and three individual countries
122While it would be difficult to foresee the implications of AIDS for the age structure with any precision, it is nevertheless clear that the huge excess mortality at the adult ages caused by the pandemic will create an important deficit of individuals, particularly above 40.
123Overall, the age structure of sub-Saharan Africa will change slowly during the next two or three decades. Some countries will experience marked changes in their age distribution as a result of fertility decline, whereas in others there will be sudden and rapid changes as a consequence of AIDS.
XII – Urbanization and rural exodus : profound changes since 1950
124Urbanization is one of the most significant transformations experienced by sub-Saharan Africa during the last fifty years. Only 13% of the population lived in cities as of 1950, whereas over one third is now concentrated in urban areas (Table 14) [44]. The level of urbanization is still low compared with South America and North Africa [45] — where the proportions urban were already far larger in the 1950s — but urban growth has been much faster in the last 50 years. The total urban population of the region has increased eleven-fold during that period, rising from some 20 million in 1950 to close to 220 million in 2000, whereas in the same period the rural population rose from 156 to 430 million (or by a factor of 2.7). According to the United Nations projections, urban growth is likely to continue — in 2030, over 600 million individuals (one in every two Africans) will be living in cities.
Proportion urban by sub-region from 1950 to 2000 (in %), and projection to 2030

Proportion urban by sub-region from 1950 to 2000 (in %), and projection to 2030
125Of course, urban growth is due in part to natural increase (birth and death rates) in the cities, but also — and this accounts for the much faster growth than for the rural population — to the migration from the countryside to the cities, and to the reclassification of rural settlements into urban ones. On the whole, migration and reclassification accounted for about half the growth of the population of cities in Africa in the 1960s and 1970s, but natural increase currently appears to be playing the most important role. According to some authors, it accounts for almost three fourths of the urban growth on the continent since the 1980s (Chen et al., 1998).
1 – The heterogeneous character of urbanization among countries
126In this respect too, there is great diversity in urbanization levels among sub-regions and among African countries (Table 14 and Table A.13 of the Appendix). Southern Africa, today as in the early 1950s, is far more urbanized than the other regions of the continent. Over half of its population lives already in cities, particularly as a result of South Africa’s relatively high proportion urban (58%). On the contrary, barely a quarter of the population of East Africa is urban, with extremely low levels in Rwanda (6%) and Burundi (9%) and a majority of countries around 30% (e.g. the Comoros, Kenya, Madagascar, Mozambique). The proportion of city dwellers is 39% in West Africa, and ranges from 17% in Burkina Faso to more than 60% in Cape Verde, with around 40% in about half the countries of the sub-region (e.g. Benin, Nigeria, Côte d’Ivoire). Finally Central Africa, with its population a little more than one third (35%) urban, is close to the continental average, but includes some of the most urbanized countries in Africa : Gabon (82%) and Congo (66%).
127On the whole, however, the heterogeneity in the degree of urbanization between sub-regions has lessened since the 1950s, as the least urbanized regions 50 years ago have experienced the highest urban growth. East Africa, for example, where the level was very low in 1950, underwent a particularly rapid growth of its urban population (an average annual growth of 5.9%) that was practically multiplied by 20 between 1950 and 2000, while the proportion urban was multiplied by 5. Urban growth has also been very rapid in West Africa (population multiplied by 15 in 50 years, annual growth of 5.4%, proportion urban multiplied by 4). In contrast, it has been more moderate in Central Africa (urban population multiplied by 9, growth rate of 4.4%) and relatively low in Southern Africa (multiplied by 4, growth of 2.8%) which, as previously mentioned, had started from a higher level. Finally, for the whole of sub-Saharan Africa, the urban population has grown at an average annual pace close to 4.8% over fifty years. This average conceals, however, a slight tapering of urban growth, which was slower during the 1980s and 1990s (when the annual growth rate was 4.6%) than during the 1960s and 1970s (5.0%).
2 – The emergence of the megalopolis
128The rapid growth of the urban population occurred concurrently with the emergence of large cities, and even a few megalopolises across the continent (Table 15) [46]. In 2000 Africa numbers 27 cities with more than 1 million inhabitants (including 19 capital cities), whereas there were only four (Lagos, Kinshasa, Capetown, Johannesburg) 25 years earlier, and none in 1950. The population of Lagos, the largest urban cluster in sub-Saharan Africa, approaches 9 million, or five times its size in 1975, and 30 times that in 1950 ! Kinshasa currently reaches 5 million, also 30 times larger than fifty years ago, and three times larger than in 1975. Abidjan is close to 4 million, and several other cities exceed 2 million people (e.g. Luanda, Addis Ababa, Khartoum). In some countries, over 20% of the total population and over half the urban population (Table 15) live in these large cities (Abidjan) or capitals (Dakar, Luanda, Brazzaville). In others, a much smaller proportion live in the capital, though the latter is sometimes quite a large city. A diversity of urban systems are thus to be found in Africa, and not a single macrocephalous model (Dubresson, 2003).
Population of selected capitals between 1950 and 2000, and projection to 2015

Population of selected capitals between 1950 and 2000, and projection to 2015
129These large cities will go on growing in number and their size will increase in the coming decades. They will absorb a growing proportion of the African urban population (Dubresson, 2003) [47]. However, the pace of growth is likely to decrease, in line with the slowdown that is already taking place. Thus, for the 12 cities in Table 15, the annual growth rate, which was an average 6.7% during the period 1950-1975, was 5.0% between 1975 and 2000, and is expected to be a mere 3.8% between 2000 and 2015, according to United Nations projections.
3 – A slowdown in urban growth
130The slowdown is observed not only in the major cities, but often also in the rest of the urban world. Although the extent of the slowdown is a matter of debate, depending on the sources of data used, several recent studies suggest that the pace of urban growth in Africa has abated (Potts, 1995), or even that certain countries such as Côte d’Ivoire or Zambia are undergoing de-urbanization (Beauchemin et al., 2004). The slowdown varies between regions and countries, and reflects both a decline of the rate of natural increase in cities and, most of all, a slowing down of migration to the urban areas and sometimes an intensification of return migration to the countryside (Beauchemin and Bocquier, 2003 ; Potts, 1995 ; Potts, 2000). The part played by migration in urban growth in Africa has thus significantly diminished since the 1960s (Bocquier, 2003 ; Chen et al., 1998), among other reasons because of the effects of economic crises and of the structural adjustment programmes initiated from the 1980s onwards (Beauchemin and Bocquier, 2003 ; Becker et al., 1994). This put a brake on recruitment into the civil service and increased unemployment, particularly among young people.
XIII – International migration within Africa : labour migration and forced migration
131International migration is still the least well known and the most poorly measured demographic phenomenon, in Africa even more than in other parts of the world. The main indicators of international migration, available for a majority of African countries, are the number of individuals who live in a country and were born in another (international immigrants), and that number compared with the population of the country of residence, an index referred to as the proportion of migrants (Zlotnik, 2003) [48]. Those indicators, which are derived from a census question on the place of birth, thus refer to the stock of migrants and not to migration flows, which are seldom available [49]. They provide imperfect measures of the complexity of migration, as they fail to take temporary migration, circular migration, short-term fluctuations, etc., into proper account [50]. Despite these deficiencies, those indicators make it possible to trace some major features of international migration in Africa and to identify major poles of attraction to migrants. In 2000 there were approximately 15.1 million international immigrants (in the sense defined above) in sub-Saharan Africa or 2.2% of the total population. The proportion has declined markedly since the 1960s, when it was almost 4% (Zlotnik, 2003). However, it is still far higher than in most other regions of the developing world (1.4% in Asia, 1.1% in Latin America and the Caribbean) [51]. International migration within Africa thus remains important. The volumes and the motives of migration, however, as well as the characteristics of the migrants, vary appreciably within the continent.
132With close to 7 million international immigrants in 2000, West Africa is currently the region with the largest number of migrants, before East Africa where there are 5.3 million, and Central and Southern Africa where they represent 1.5 million. In relative terms, West and Southern Africa rank first, with international immigrants accounting for 3% of their population, whereas they represent only 1.6% and 1.9% respectively in Central and East Africa.
133The data by country (Table A.12 of the Appendix) show that the situations are very heterogeneous in Africa and highlight the major poles of attraction for migrants. The most striking and well-known example is Côte d’Ivoire, with over 2.3 million immigrants in 2000, which accumulated by far the largest number of international immigrants in Africa, far ahead of South Africa (1.3 million) or Burkina Faso (1.1 million) [52]. They represented close to 15% of the population in Côte d’Ivoire, a proportion much larger than in most other African countries. This reflects the importance of migration in the past as well as the present economy of the country and of the neighbouring francophone countries (Burkina Faso and Mali), from where most of the immigrants originate (Makinwa-Adebusoye, 1992) [53]. A few other small African countries (Gabon, Reunion, Gambia) also reach or exceed 15% of migrants, but that represents only 250,000, 106,000 and 185,000 migrants respectively, a small proportion in the total number of migrants in Africa. Conversely, large countries such as Nigeria or South Africa, though they host comparatively low proportions of migrants (under 1% in Nigeria, 3% in South Africa), receive an important number of individuals (over two million for these two countries taken together).
134The motives behind international migration in Africa are diverse ; they have varied through time and differ noticeably from one region or country to another. Labour migration is an important part of overall migration in Africa, as elsewhere in the world. For example, migration to Côte d’Ivoire, South Africa or Gabon, to mention only a few countries, is largely motivated by the quest for work and income in more prosperous economies where the demand for labour is greater than in the countries of emigration.
135Refugees are another large category of international migrants in Africa, and one that increased appreciably during the last few decades as a result of the conflicts or civil wars that various countries of the continent experienced or are still experiencing. The number of refugees in sub-Saharan Africa rose from less than 100,000 in the early 1960s to more than 5 million in the mid-1990s, and dropped back to 3 million around 2000 (Zlotnik, 2003). They made up scarcely 1% of the total number of migrants in the early 1960s, close to 40% around 1995, and 20% today. In 2000 Africa accounts for one quarter of the total number of refugees in the world. From the early 1980s, the largest number of refugees has been in East Africa (1.9 million today), with 700,000 in Tanzania, or over 20% of the total number of refugees in Africa. Other important receiving countries include Zambia, Sudan, Uganda, Kenya, DR Congo and Guinea (Table A.12 of the Appendix). The main countries of origin of the refugees in Africa in 2002 were Burundi, Sudan, Angola, Somalia and DR Congo.
136Because detailed data are lacking, it is difficult to examine the evolution of migratory flows from and to certain countries, and any reversals of the direction of these flows. However, it is well known that migration is strongly influenced by economic crises and political upheaval. The flows of refugees are the most obvious illustration, but labour migration (whether legal or illegal) is also affected by these changes. For example, the end of apartheid in South Africa and the opening up of the country in the early 1990s provoked an influx of migrants originating, among other countries, in DR Congo, Nigeria and Senegal (Adepoju, 2000). On the contrary, in Côte d’Ivoire and Gabon, the economic crisis and the more restrictive migration policies enforced in the 1990s appear not only to have slowed down migration to those countries, but also to have accelerated return migration (Adepoju, 2000).
XIV – Migration to the rich countries : increasing flows and diversification of the destinations
137Just like international migration within Africa, African migration to the developed countries is still insufficiently documented. Despite recent efforts in North America and Europe, the data needed to evaluate the phenomenon, which mainly come from the developed countries’ immigration statistics, are not only scarce in quantity, but also variable in quality from one country to another. Such statistics, by definition, also do not take illegal migration into account, so that migration flows from Africa are often underestimated. On the whole, they should be examined cautiously [54].
1 – From the 1960s to the 1980s
138Since the early 1960s, i.e. the period of decolonisation, migratory flows from sub-Saharan Africa to the developed countries have been increasing [55]. In the early 1960s about 17,000 individuals migrated yearly from sub-Saharan Africa to Western Europe, North America and Oceania taken together, as against nearly 80,000 in the late 1980s (Table 16) [56]. Europe witnessed a period of large increase first between the 1960s and the 1970s, with annual numbers rising from under 14,000 to over 50,000 migrants. This was followed by a slowdown in the late 1970s and the early 1980s, and by a new spurt until the numbers reached 51,000 migrants around 1990. The increase of the flow to North America and Oceania was more steady, rising from 4,000 migrants annually to approximately 26,000 in the late 1980s. Thus, around 1990, the United States, Canada, Australia and New Zealand received a larger proportion of African migrants than in the early 1960s (34% as against about 20%). Europe, with two-thirds of the total, remained by far the primary destination among the developed regions.
Average annual numbers of immigrants from sub-Saharan Africa to the developed countries from 1960 to 1991

Average annual numbers of immigrants from sub-Saharan Africa to the developed countries from 1960 to 1991
139The increase in the flows to the United States, Canada and Australia is a sign that the destinations of African migrants are diversifying, as they are within Europe too. Whereas in the 1960s and 1970s the main migration flows went mainly from the former colonies to the former colonial powers (France, Britain, Portugal, Belgium), the symmetry no longer applies, with the growing importance of migration to such countries as Italy, the Netherlands or Germany (Hamilton, 1997 ; Zlotnik, 1996). The Gulf countries also seem to be an increasingly popular destination for African migrants, particularly the more educated ones (Adepoju, 2000).
2 – Since the early 1990s
140Despite what might have been expected with the increasingly strict migration policies enforced in the rich countries, migration to those countries continued to increase during the 1990s (Hamilton, 1997). For example, in France, the annual number of migrants from sub-Saharan Africa has more than doubled from 1994 to 2001, rising from 11,000 to 26,000 migrants, a much faster increase than that of migrants from other regions except North Africa (Table 17) [57]. On the whole, the former colonies are still the main countries of emigration — in 2001 Senegal ranked first, before Cameroon and Côte d’Ivoire. However, the Democratic Republic of the Congo is an exception, as the main country of origin of migrants from sub-Saharan Africa in 1994 and 1997. The share of sub-Saharan Africa in the migration to France rose from 9% in 1994 to more than 14% in 2001, and that of North Africa from 20 to 29%.
Long-term immigration by year of admission as regular residents in France, 1994-2001

Long-term immigration by year of admission as regular residents in France, 1994-2001
141We shall not consider the various factors behind the migration from sub-Saharan Africa. Suffice it to say that motivations for coming to Europe, particularly to France, have changed noticeably. Whereas up to the mid-1980s, migration was mainly related to employment, it is now related more to family reunification, education and requests for asylum (Thierry, 2001).
XV – A key factor : the education of men and women
142Although the complex issue of the relation between education and economic and social development will not be discussed here, “education is, according to many economists, an investment in training and information likely to promote both economic growth and the modernization of demographic behaviour” (Hugon, 1996, p. 209). The essential role of education as a factor of human development and social progress is universally acknowledged today, in the world of science as well as that of intervention.
143Though men’s educational level should not be neglected, in demography, that of women is virtually the most discriminating variable explaining individual behaviour in the areas of fertility, marriage and health [58]. A few very simple examples have been briefly mentioned above. At a more contextual level, for example the country level, the expansion of education in a society is of primary importance for demographic transition, whether ongoing or to come.
144What is the present status of literacy and schooling in Africa ? What happened to inequality between men and women ? Is there any clear relation between the countries’ level of educational development and fertility or child mortality ? Table A.14 of the Appendix presents the rates of adult literacy and primary school enrolment by sex in 48 countries [59]. Table 18 shows the situation of sub-Saharan Africa compared with that of other developing regions in the areas of primary education, illiteracy and inequality between the sexes.
Net rates of primary school enrolment (in %), proportions of adult illiterates (in %) and difference between the sexes for a few regions of the world in 2000

Net rates of primary school enrolment (in %), proportions of adult illiterates (in %) and difference between the sexes for a few regions of the world in 2000
1 – Illiteracy remains a real problem, particularly among women
145In the last 30 or 40 years, considerable progress has been achieved in the matter of education across the world. The phrase “schooling explosion” has even been used to describe the joint population growth and expansion of school systems (UNESCO, 2003 ; United Nations, 2003a). But despite such substantial progress, illiteracy remains very widespread, affecting 40% of adults in the Arab world and sub-Saharan Africa, and 45% in South and West Asia. Much lower levels — about 12% (Table 18) — are found in Latin America and East Asia. In Africa, the number of illiterate individuals continues to grow as a consequence of population increase.
146Everywhere in the world, women are most affected by far, with illiteracy rates that are 1.2 to 2.4 times higher than those of men. For similar levels, on average the differences between men and women are slightly smaller in sub-Saharan Africa than in South or West Asia or the Arab world.
147In this area too, there are currently wide inequalities in Africa, with proportions of individuals who can read and write that are on average [60]45% in West Africa, 64 to 68% in Central and East Africa and 81% in Southern Africa, and national levels only around 20% in Sahel countries such as Niger, Mali or Burkina Faso, and at the other end of the spectrum over 80% in all the countries of Southern Africa (Figure 12).
Literacy rates (in %) for men and women in 38 countries in 2000

Literacy rates (in %) for men and women in 38 countries in 2000
148Except for those few countries where the vast majority of the population can read and write, all the other African countries present strong disparities between men and women ; the lower the educational level, the wider the disparities (Figure 12). The fight against illiteracy and gender disparities is far from over. Let us now look at schooling among young people.
2 – Insufficient school enrolment and a great variety of situations in Africa
149While there is hardly any difference between Africa and some other regions in the world (North Africa, South and West Asia) in terms of illiteracy, there are differences in primary schooling (Table 18). In 2000, with a rate of 64% (for both sexes together), the region was far behind the Arab world (81%), South and West Asia (81%) and of course East Asia (93%). On the other hand, with girls’ school enrolment lower by 10% on average, inequality by sex, though real, is not greater than in North Africa or South Asia.
150As in the case of illiteracy, the disparities between countries are still wide (Figure 13). On the one hand, in the Southern African nations and in Gabon and Cape Verde, over 80% of the children are enrolled in primary schools ; on the other hand, in such countries as Niger, Burkina Faso, Angola and Djibouti, the rates are as low as 30%.
Net rates (%) of primary school enrolment by sex in 32 countries in 2000

Net rates (%) of primary school enrolment by sex in 32 countries in 2000
151Inequality between the sexes is on the whole less important than for adult illiteracy. It is true that for the entire region, school enrolment rates for girls are 11% lower than for boys [61], but in 13 countries with markedly different overall levels of education, equality between the sexes is virtually a fact. On the other hand, in countries like Benin, Côte d’Ivoire, Chad or the Central African Republic, girls’ school enrolment rates are lower by approximately 30%. In the last 30 years, much progress has been achieved, without resulting in an important decline of discrimination against girls. In addition, the question is now raised, and legitimately, of the effects of economic recession, the recurring decline of purchasing power and the increasing cost of education (because, for example, of the privatisation of parts of the educational system) on the demand for schooling on the part of the parents, and its effect on the disparities between boys and girls. The various historical, economic and cultural factors underlying this persisting inequality will not be discussed here [62].
3 – Education in relation to fertility and infant mortality in the various countries
152For all the developing countries together, the classic observation is that fertility or infant mortality and the countries’ educational level are fairly closely related. What is the situation in sub-Saharan Africa in 2000, with respect to the women’s literacy levels ?
153The correlation with fertility is relatively strong, explaining 45% of the variance (R2), and negative as expected (Figure 14). Overall, the higher the proportion of literate women, the lower the fertility in a country. The correlation is higher than with men’s literacy (R2 = 0.31) (not presented here). It is also quite close to the relation obtained (R2 = 0.39) among 152 regions of Africa, using the proportion of women aged 15-49 with no education (Tabutin and Schoumaker, 2001). The correlation between fertility and education is slightly lower in Africa, however, than elsewhere, where the R2 may be as high as 0.60. The relation is present, but it is far from perfect (Figure 14). This is not surprising : in particular, fertility is quite variable among countries where literacy rates exceed 60%.
Relationship between fertility and adult women’s literacy in 38 countries in 2000

Relationship between fertility and adult women’s literacy in 38 countries in 2000
154The correlation with infant mortality (Figure 15) is weaker (R2 = 0.31), though still quite significant. Of course it is negative overall, but with greater variability at low levels of literacy (around 30%) as well as at higher levels (over 60%). When calculated with male literacy, the coefficient drops to 0.20.
Relationship between infant mortality and adult women’s literacy in 38 countries in 2000

Relationship between infant mortality and adult women’s literacy in 38 countries in 2000
155Such brief synchronic analysis at the aggregate level simply confirms the non-negligible role of educational development, and more particularly that of woman’s education.
Conclusion
156Demographers have long been wondering about the specificity of sub-Saharan African demography (is it an exceptional region ?), the timing and pace of the foreseeable decline of fertility or of certain components of nuptiality (polygyny, divorce), the uncertainty in the health area, the relevance of comparisons with other regional experiences in the world, the respective roles of culture, religion and policy in explaining the “lag” generally observed in Africa as compared with other regions. More recently, the role played in the dynamics of African demographic systems by poverty and economic recession, AIDS, conflicts and wars, and the evolution of women’s status, has been increasingly debated.
157This chronicle encompassed the whole of sub-Saharan Africa, and could not — nor was it its intention — address all those vast, complex, multidisciplinary issues, however necessary they are for understanding what is happening or is likely to happen soon. With the statistical material available on Africa, which has significantly improved in the last fifteen years, we have simply attempted to bring out the major trends of the last 50 years and particularly since the 1970s, as well as the current characteristics of the various elements in the demographic dynamics in the 48 countries and 4 sub-regions of sub-Saharan Africa.
158In brief, a few major characteristics appear to define the recent socio-demographic evolution in Africa :
- Insufficiency of basic demographic information, particularly on the most disadvantaged countries or those most affected by wars and conflicts (e.g. DR Congo, Congo, Angola, Somalia). Social and health statistics are often especially poor.
- Rapid and probably irreversible diversification of African demographic regimes. For 10 or 15 years now, there has been not one African demography, but several.
- Fragility or uncertainty of recent changes, for example in such areas as polygyny, contraception, education or adult mortality in those countries relatively unaffected by AIDS.
- Sometimes brutal reversibility of progress in certain areas such as adult or infant and child mortality and health, because of AIDS, conflict and poverty. Southern Africa, by far the most developed region, but also the most severely affected by AIDS, is paradoxically the region where life expectancy is now lowest.
- Increase in social inequality and spatial disparities within the countries, with respect to fertility as well as nuptiality and mortality, particularly between the rural and urban worlds, and between the poorer social groups and the others.
- Uncertainty concerning the role of economic or cultural poverty of households and individuals in the future of the demographic transitions that have begun. The role of gender relations is equally uncertain.
159The demographic future of sub-Saharan Africa will probably be guided by development in the few nations that are most advanced and stable from every point of view (fairly classic, rapid and irreversible transitions), by poverty in many others (transitions which in our view will be rather slow, late and vulnerable), and by crises in a few other countries (chaotic transitions, with alternating episodes of progress and regression). In an economic context which on the whole will probably remain very difficult in the next few decades, the speed and the modalities of the transitions will largely depend on the policies and priorities of programmes in the areas of social development, education, health and family planning that the nations, societies and communities involved will adopt.
Acknowledgements
The authors express their gratitude to Jean-Pierre Zamwangana, research trainee at the UCL Institute of Demography, for his precious assistance in the compilation of the data analysed here.Statistical Appendix
Censuses, national fertility and health surveys and other national household demographic surveys from 1960 to 2004 (48 countries)

Censuses, national fertility and health surveys and other national household demographic surveys from 1960 to 2004 (48 countries)
Land area and densities in 2000, and population from 1950 to 2040 (48 countries)

Land area and densities in 2000, and population from 1950 to 2040 (48 countries)
Crude birth and death rates and rate of natural increase, 1950 to 2004 (48 countries)

Crude birth and death rates and rate of natural increase, 1950 to 2004 (48 countries)
Median ages at first marriage (men and women), prevalence of polygyny, and proportion of never married women (48 countries)

Median ages at first marriage (men and women), prevalence of polygyny, and proportion of never married women (48 countries)
Total fertility rates and net reproduction rates, 1950 to 2005 (48 countries)

Total fertility rates and net reproduction rates, 1950 to 2005 (48 countries)
Most recent indices of level and timing, and characteristics of fertility in 30 countries

Most recent indices of level and timing, and characteristics of fertility in 30 countries
Breastfeeding, postpartum sexual abstinence and contraception in 30 countries

Breastfeeding, postpartum sexual abstinence and contraception in 30 countries
Life expectancy and infant mortality, 1950 to 2004 (48 countries)

Life expectancy and infant mortality, 1950 to 2004 (48 countries)
Conditions of delivery, mortality and health of children in 30 countries

Conditions of delivery, mortality and health of children in 30 countries
Maternal mortality and hiv prevalence at 15-49 (48 countries)

Maternal mortality and hiv prevalence at 15-49 (48 countries)
Proportion of the population under 15 and 60 and over, and median age from 1950 to 2020 ; dependency ratio and sex ratio in 2000 (48 countries)

Proportion of the population under 15 and 60 and over, and median age from 1950 to 2020 ; dependency ratio and sex ratio in 2000 (48 countries)
International migration, refugees and displaced populations (48 countries)

International migration, refugees and displaced populations (48 countries)
Development indicators (economy, education, human development and poverty) in 47 countries of the region around 2001

Development indicators (economy, education, human development and poverty) in 47 countries of the region around 2001
School enrolment and adult literacy by sex in 2000 (48 countries)

School enrolment and adult literacy by sex in 2000 (48 countries)
REFERENCES
This bibliography includes references quoted in the text, but also a selection of articles and books that are representative of recent studies on African demography.- Adepoju A., 2000, “Issues and recent trends in international migration in sub-Saharan Africa”, International Social Science Journal, 165, pp. 383-394.
- Adepoju A., C. Oppong (eds.), 1993, Gender, Work and Population in sub-Saharan Africa, London, James Currey, 245 p.
- Adjamagbo A., V. Delaunay, 1998, “La crise en milieu rural ouest-africain : implications socia-les et conséquences sur la fécondité. Niakhar (Sénégal), Sassandra (Côte d’Ivoire), deux exemples contrastés”, in F. Gendreau (ed.), Crises, pauvreté et changements démo-graphiques dans les pays du Sud, Paris, Estem, pp. 339-355.
- Akoto E.M., D. Tabutin, 1992, “Socio-economic and cultural differentials in the mortality of sub-Saharan Africa”, in E. van de Walle, G. Pison, M. Sala-Diakanda (eds.), Mortality and Society in sub-Saharan Africa, Oxford, Clarendon Press, pp. 32-64.
- Antoine P., 2002, “Les complexités de la nuptialité : de la précocité des unions féminines à la polygamie masculine en Afrique”, in G. Caselli, J. Vallin, G. Wunsch (eds.), Démographie : analyse et synthèse. II – Les déterminants de la fécondité, Paris, INED, pp. 75-102.
- Antoine P., 2003, “Nuptialité et conditions de vie dans les villes africaines”, in T. Eggerickx, C. Gourbin, B. Schoumaker, C. Vandeschrick, É. Vilquin (eds.), Populations et défis urbains. Actes de la Chaire Quetelet 1999, Louvain-la-Neuve, Academia-Bruylant/ L’Harmattan, pp. 581-604.
- Antoine P., F. Dial, 2003, Mariage, divorce et remariage à Dakar et Lomé, Paris, DIAL (Working Paper, 2003/07), 21 p.
- Antoine P., D. Ouedraogo, V. Piché (eds.), 1999, Trois générations de citadins au Sahel. Trente ans d’histoire sociale à Dakar et à Bamako, Paris, L’Harmattan, 282 p.
- Barbieri M., 1994, “Is the current decline in infant and child mortality in sub-Saharan Africa a sign of future fertility change ?”, in T. Locoh, V. Hertrich (eds.), The Onset of Fertility Transition in sub-Saharan Africa, Liège, Derouaux Ordina, pp. 21-42.
- Beauchemin C., P. Bocquier, 2003, Migration and Urbanization in Francophone West Africa : A Review of the Recent Empirical Evidence, Paris, DIAL (Working Paper, 2003/09), 23 p.
- Beauchemin C., S. Henry, B. Schoumaker, 2004, “Rural-urban migration in West Africa : Toward a reversal ?”, paper read at the annual meeting of the Population Association of America, Boston.
- Becker C., A. Hamer, A. Morrison, 1994, Beyond Urban Bias in Africa. Urbanization in an Era of Structural Adjustment, Portsmouth, Heinemann, 294 p.
- Beninguisse G., 2003, Entre tradition et modernité. Fondements sociaux de la prise en charge de la grossesse et de l’accouchement au Cameroun, Louvain-la-Neuve, Academia-Bruylant/L’Harmattan, 297 p.
- Biaye M., 1994, Inégalités sexuelles en matière de santé, de morbidité et de mortalité dans l’en-fance dans trois pays de l’Afrique de l’Ouest, Louvain-la-Neuve, Academia-Bruylant/ L’Harmattan, 292 p.
- Biraben J.-N., 2003, “The rising numbers of humankind”, Populations & Societies, 394 (available on line at : http :// www. ined. fr/ englishversion).
- Bledsoe C., G. Pison (eds.), 1994, Nuptiality in sub-Saharan Africa. Contemporary Anthropological and Demographic Perspectives, Oxford, Clarendon Press, 326 p.
- Bocquier P., 2003, “L’urbanisation a-t-elle atteint son niveau de saturation en Afrique de l’Ouest ?”, in T. Eggerickx, C. Gourbin, B. Schoumaker, C. Vandeschrick, É. Vilquin (eds.), Populations et défis urbains. Actes de la Chaire Quetelet 1999, Louvain-la-Neuve, Academia-Bruylant/L’Harmattan, pp. 135-163.
- Bocquier P., S. Traoré, 1996, “Migrations en Afrique de l’Ouest : de nouvelles tendances”, La Chronique du CEPED, n° 20.
- Cahiers Québécois de Démographie, 1992, Démographie sociale en Afrique, 21(1), 211 p.
- Caldwell J., I.O. Orululoye, P. Caldwell, 1992, “Fertility decline in Africa : a new type of transition ?”, Population and Development Review, 18(2), pp. 211-239.
- Calvès A.-E., 2002, “Abortion risks and abortion decision among African youth : Evidence from urban Cameroon”, Studies in Family Planning, 33(3), pp. 249-260.
- CEPED, 1994, La démographie de 30 États d’Afrique et de l’Océan indien, Paris, CEPED, 351 p.
- CERPOD, 1995, Migrations et urbanisation en Afrique de l’Ouest. Résultats préliminaires, Bamako, CERPOD, 30 p.
- Chen N., P. Valente, H. Zlotnik, 1998, “What do we know about recent trends in urbanization ?”, in R. Bilsborrow (ed.), Migration, Urbanization and Development : New Directions and Issues, Dordrecht, UNFPA-Kluwer, pp. 59-88.
- Cleland J., N. Onuoha, I. Timaeus, 1994, “Fertility change in sub-Saharan Africa : a review of the evidence”, in T. Locoh, V. Hertrich (eds.), The Onset of Fertility Transition in sub-Saharan Africa, Liège, Derouaux Ordina, pp. 1-20.
- Cohen B., 1998, “The emerging fertility transition in sub-Saharan Africa”, World Development, 26(8), pp. 1431-1461.
- Cohen D., E. Reid, 1999, “The vulnerability of women : is this a useful construct for policy and programming ?”, in C. Becker, J.-P. Dozon, C. Obbo, M. Touré (eds.), Vivre et penser le sida en Afrique, Paris, Karthala-Codesria-IRD, pp. 377-388.
- Coquery-Vidrovitch C., 1988, “Les populations africaines du passé”, in D. Tabutin (ed.), Population et sociétés en Afrique au sud du Sahara, Paris, L’Harmattan, pp. 51-72.
- Cordell D., 2001, “Population and demographic dynamics in sub-Saharan Africa in the second millenium”, paper presented at the History of World Population in the Second Millenium, Florence, IUSSP.
- Cordell D., J. Gregory, V. Piché, 1998, Hoe and Wage : A Social History of a Circular Migration System in West Africa, 1900-1975, Boulder, Westview Press, 384 p.
- Coussy J., J. Vallin (eds.), 1996, Crise et population en Afrique, Paris, CEPED, 580 p.
- Delaunay V., 1994, L’entrée en vie féconde, Paris, CEPED, 326 p.
- Desclaux A., Taverne B., 2000, Allaitement et VIH en Afrique de l’Ouest, Paris, Karthala (Coll. Médecines du monde), 556 p.
- Donadjé F., 1992, Nuptialité et fécondité des hommes au Sud-Bénin : une approche des straté-gies de reproduction au Bénin, Institut de Démographie, Université catholique de Louvain-la-Neuve, Academia-Erasme, 222 p.
- Dubresson A., 2003, “L’Afrique sub-saharienne face au défi urbain”, in T. Eggerickx, C. Gourbin, B. Schoumaker, C. Vandeschrick, É. Vilquin (eds.), Populations et défis urbains. Actes de la Chaire Quetelet 1999, Louvain-la-Neuve, Academia-Bruylant/ L’Harmattan, pp. 51-78.
- Evina A., 1994, “Infertility in sub-Saharan Africa”, in T. Locoh, V. Hertrich (eds.), The Onset of Fertility Transition in sub-Saharan Africa, Liège, Derouaux Ordina, pp. 251-266.
- Feeney G., 2001, “The impact of HIV/AIDS on adult mortality in Zimbabwe”, Population and Development Review, 27(4), pp. 771-780.
- Ferry B., 2002, “L’impact démographique du VIH/SIDA”, La Chronique du CEPED, n° 44.
- Foote K., K. Hill, L. Martin (eds.), 1996, Changements démographiques en Afrique sub-saharienne, Paris, INED (Coll. Travaux et documents, Cahier n° 135), 372 p.
- Gendreau F., 1993, La population de l’Afrique. Manuel de démographie, Paris, Karthala-CEPED, 463 p.
- Guillaume A., 2003a, L’avortement en Afrique. Une revue de la littérature des années 1990 à nos jours, Paris, CEPED (CD-Rom).
- Guillaume A., 2003b, “The role of abortion in the fertility transition in Abidjan (Côte d’Ivoire) during the 1990s”, Population-E, 58(6), pp. 657-686.
- Guillaume A., A. Desgrées du Loû, 2002, “Fertility regulation among women in Abidjan, Côte d’Ivoire : contraception, abortion or both ?”, International Family Planning Perspectives, 28(3), pp. 159-166.
- Hamilton K., 1997, “Europe, Africa, and international migration : an uncomfortable triangle of interests”, PSTC Working Paper, 97-02, Providence, Brown University, 44 p.
- Hertrich V., 2001, “Nuptialité et rapports de genre en Afrique. Un bilan des tendances de l’en-trée en union au cours des 40 dernières années”, paper read at the Gender, Population and Development in Africa international colloquium, Abidjan, UEPA/INED/ENSEA/IFORD.
- Hugon P., 1996, “Les systèmes éducatifs africains dans un contexte de récession et d’ajuste-ment”, in J. Coussy, J. Vallin (eds.), Crise et population en Afrique, Paris, CEPED, pp. 209-231.
- Jolly C., J. Gribble, 1996, “Les déterminants proches de la fécondité”, in K. Foote, K. Hill, L. Martin (eds.), Changements démographiques en Afrique sub-saharienne, Paris, INED, pp. 71-117.
- Klissou P., 1995, La polygamie au Bénin. Une approche régionale des tendances et des déter-minants, Louvain-la-Neuve, Academia-Bruylant/L’Harmattan, 257 p.
- Kobiané J.-F., 2001, “Revue générale de la littérature sur la demande d’éducation en Afrique”, in M. Pilon, Y. Yaro (eds.), La demande d’éducation en Afrique. État des connaissances et perspectives de recherche, Dakar, UEPA (Coll. Réseaux thématiques de recherche de l’UEPA, n° 1), pp. 19-47.
- Kuate-Defo B. (ed.), 1998, Sexualité et santé reproductive durant l’adolescence en Afrique, Montreal, Ediconseil, 394 p.
- Lange M.-F., 2001, “L’évolution des inégalités d’accès à l’instruction en Afrique depuis 1960”, paper read at the Gender, Population and Development in Africa international colloquium, Abidjan, UEPA/INED/ENSEA/IFORD.
- Larsen U., 1994, “Sterility in sub-Saharan Africa”, Population Studies, 48(3), pp. 459-474.
- Lesthaeghe R. (ed.), 1989, Reproduction and Social Organization in sub-Saharan Africa, Berkeley, University of California Press, 556 p.
- Lesthaeghe R., G. Kaufmann, D. Meekers, 1989, “The nuptiality regimes in sub-Saharan Africa”, in R. Lesthaeghe (ed.), Reproduction and Social Organization in sub-Saharan Africa, Berkeley, University of California Press, pp. 238-337.
- Locoh T., 1996, “Changements des rôles masculins et féminins dans la crise : la révolution si-lencieuse”, in J. Coussy, J. Vallin (eds.), Crise et population en Afrique, Paris, CEPED, pp. 445-469.
- Locoh T., V. Hertrich (eds.), 1994, The Onset of Fertility Transition in sub-Saharan Africa, Liège, Derouaux Ordina, 305 p.
- Lohlé-Tart L., M. François, 1999, État civil et recensements en Afrique francophone, Paris, CEPED (Les documents et manuels du CEPED, n° 10), 564 p.
- Makinwa-Adebusoye P., 1992, “The West African migration system”, in M. Kritz, L. Lim, H. Zlotnik (eds.), International Migration Systems. A Global Approach, Oxford, Clarendon Press, pp. 63-79.
- Marcoux R., 1997, “Nuptialité et maintien de la polygamie en milieu urbain au Mali”, Cahiers québécois de démographie, 26(2), pp. 191-215.
- Mathieu P., D. Tabutin, 1996, “Démographie, crise et environnement dans le monde rural afri-cain”, in J. Coussy, J. Vallin (eds.), Crise et population en Afrique, Paris, CEPED, pp. 123-160.
- Meslé F., 2003, “La transition sanitaire. Progrès et résistance en Afrique”, paper read at the Population issues in Mali. From international issues to local perspectives colloquium, Bamako.
- National Research Council, 1993a, Demographic Effects of Economic Reversals in sub-Saharan Africa, Washington, National Academy Press, 193 p.
- National Research Council, 1993b, Factors Affecting Contraceptive Use in sub-Saharan Africa, Washington, National Academy Press, 252 p.
- Page H., R. Lesthaeghe (eds.), 1981, Child-Spacing in Tropical Africa : Tradition and Change, New York, Academic Press, 322 p.
- Piché V., E.K. Vignikin, M. Guèye, R. Marcoux, M.K. Konaté, 2001, “Migration et transition démographique en Afrique”, in F. Gendreau (ed.), Les transitions démographiques des pays du Sud, Paris, Estem, pp. 65-78.
- Pilon M., R. Clignet, 2001, “Questionnements méthodologiques sur la mesure des inégalités de scolarisation entre garçons et filles”, paper read at the Gender, Population and Development in Africa international colloquium, Abidjan, UEPA/INED/ENSEA/IFORD.
- Potts D., 1995, “Shall we go home ? Increasing urban poverty in African cities and migration processes”, Geographical Journal, 161(3), pp. 245-264.
- Potts D., 2000, “Urban unemployment and migrants in Africa : evidence from Harare, 1985-1994”, Development and Change, Vol. 31(4), pp. 879-910.
- Randall S., T. LeGrand, 2003, “Reproductive strategies and decisions in Senegal : the role of child mortality”, Population-E, 58(6), pp. 687-716.
- Sala-Diakanda M., 1980, Approche ethnique des phénomènes démographiques : le cas du Zaïre, Louvain-la-Neuve, Cabay, 433 p.
- Schoumaker B., 2004, “Poverty and fertility in sub-Saharan Africa. Evidence from 25 countries”, paper read at the annual meeting of the Population Association of America, Boston.
- Schoumaker B., D. Tabutin, M. Willems, 2004, “Dynamiques et diversités démographiques dans le monde (1950-2000)”, in G. Caselli, J. Vallin, G. Wunsch (eds.), Démographie : analyse et synthèse. V – Histoire du peuplement et prévisions, Paris, INED, pp. 213-247.
- Shapiro D., B.O. Tambashe, 2003a, “Villes et transition de la fécondité en Afrique au sud du Sahara”, in T. Eggerickx, C. Gourbin, B. Schoumaker, C. Vandeschrick, É. Vilquin (eds.), Populations et défis urbains. Actes de la Chaire Quetelet 1999, Louvain-la-Neuve, Academia-Bruylant/L’Harmattan, pp. 605-625.
- Shapiro D., B.O. Tambashe, 2003b, Kinshasa in Transition. Women’s Education, Employment, and Fertility, Chicago, Chicago University Press, 279 p.
- Tabutin D. (ed.), 1988, Population et sociétés en Afrique au sud du Sahara, Paris, L’Harmattan, 551 p.
- Tabutin D., 1997, “Les transitions démographiques en Afrique sub-saharienne. Spécificités, changements… et incertitudes”, in Proceedings of the International Population Conference, Beijing, IUSSP, Vol. 1, pp. 219-247.
- Tabutin D., G. Beninguisse, C. Gourbin, 2001, “Surmortalité et santé des petites filles en Afrique. Tendances des années 1970 aux années 1990”, paper read at the Gender, Population and Development in Africa international colloquium, Abidjan, UEPA/INED/EN-SEA/IFORD.
- Tabutin D., B. Schoumaker, 2001, “Une analyse régionale des transitions de fécondité en Afrique sub-saharienne”, paper read at the IUSSP International Population Conference, Salvador de Bahia (Brazil).
- Tabutin D., M. Willems, 1995, “Excess female child mortality in the developing world in the 1970s and 1980s”, Population Bulletin of the United Nations, 39, pp. 45-78.
- Thierry X., 2001, “Les entrées d’étrangers en France de 1994 à 1999”, Population, 56(3), pp. 423-450.
- Thiombiano B., 2004, Les ruptures d’union au Burkina Faso. Une analyse biographique, DEA thesis, Institut de démographie, Université catholique de Louvain-la-Neuve, 80 p.
- Timaeus I., 1999, “Adult mortality in Africa in the era of AIDS”, in UEPA (ed.), Proceedings of the Third African Population Conference, Vol. 2. Durban, UEPA, pp. 375-395.
- UNAIDS, 2003, Taking stock of the AIDS epidemic, Geneva, UNAIDS/WHO, 48 p.
- UNDP, 2003, Human Development World Report, Paris, Economica, 162 p.
- UNESCO, 2003, Gender and education for all. The challenge of equality, Paris, UNESCO, 432 p.
- UNHCR, 2004, Statistical Yearbook 2002. Trends in displacement, protection and solutions, United Nations High Commissioner for Refugees, Geneva, 542 p.
- United Nations, 1990, Patterns of First Marriage : Timing and Prevalence, New York, United Nations, 328 p.
- United Nations, 1998, “Levels and trends of sex differentials in infant, child and under-five mortality”, in United Nations (ed.), Too Young to Die : Genes or Gender ? New York, United Nations, pp. 84-108.
- United Nations, 2002a, HIV/AIDS and Fertility in sub-Saharan Africa. A Review of the Research Literature, New York, United Nations, 10 p.
- United Nations, 2002b, International Migration Report, New York, United Nations, 62 p.
- United Nations, 2002c, World Population Prospects. The 2000 Revision, Vol. 3. Analytical Report, New York, United Nations, 265 p.
- United Nations, 2002d, World Urbanization Prospects. The 2001 Revision, New York, United Nations, 321 p.
- United Nations, 2003a, Population, Education and Development, New York, United Nations, 56 p.
- United Nations, 2003b, World Population Prospects. The 2002 Revision, New York, United Nations, 781 p. + 939 p.
- Vallin J. (ed.), 1994, Populations africaines et sida, Paris, La Découverte/CEPED, 223 p.
- van de Walle E., 1996, “L’âge au mariage : tendances récentes”, in K. Foote, K. Hill, L. Martin (eds.), Changements démographiques en Afrique sub-saharienne, Paris, INED, pp. 119-154.
- van de Walle E., F. van de Walle, 1988, “Les pratiques traditionnelles et modernes des couples en matière d’espacement ou d’arrêt de la fécondité”, in D. Tabutin (ed.), Population et sociétés en Afrique au sud du Sahara, Paris, L’Harmattan, pp. 141-165.
- van de Walle E., D. Foster, 1990, Fertility decline in Africa. Assessment and prospects, Washington, The World Bank (World Bank Technical Paper, 125), 125 p.
- van de Walle E., G. Pison, M. Sala-Diakanda (eds.), 1992, Mortality and Society in sub-Saharan Africa, Oxford, Clarendon Press, 450 p.
- Vimard P., 1996, “Évolution de la fécondité et crises africaines”, in J. Coussy, J. Vallin (eds.), Crise et population en Afrique, Paris, CEPED, pp. 293-318.
- Vimard P., B. Zanou (eds.), 2000, Politiques démographiques et transition de la fécondité en Afrique, Paris, L’Harmattan, 298 p.
- Wakam J., 1994, De la pertinence des théories « économistes » de fécondité dans le contexte socio-culturel camerounais et négro-africain, Yaoundé, IFORD (Les Cahiers de l’IFORD, n° 8), 527 p.
- WHO, 2003, Maternal Mortality in 2000 : Estimates Developed by WHO, UNICEF and UNFPA, Geneva, World Health Organization, 39 p.
- World Bank, 2003, World Development Report 2003. Sustainable Development in a Dynamic World, Washington/Paris, World Bank/ESKA, 292 p.
- Zlotnik H., 1993, “South-to-North migration since 1960 : the view from the South”, International Population Congress, Montreal, IUSSP.
- Zlotnik H., 1996, “Migration to and from developing regions : a review of past trends”, in W. Lutz (ed.), The Future Population of the World. What Can we Assume Today ? London, Earthscan, pp. 299-335.
- Zlotnik H., 2003, “Migrants’ rights, forced migration and migration policy in Africa”, paper read at the Migration in Comparative Perspective conference, Johannesburg.

This article is available in open access under our model Subscribe To Open.