The Demography of China's 1958-61 Famine
A Closer Examination
- By Zhongwei Zhao
- and Anna Reimondos
Pages 281 to 308
Cite this article
- ZHAO, Zhongwei
- and REIMONDOS, Anna,
- Zhao, Zhongwei.
- et al.
- Zhao, Z.
- and Reimondos, A.
https://doi.org/10.3917/popu.1202.0329
Cite this article
- Zhao, Z.
- and Reimondos, A.
- Zhao, Zhongwei.
- et al.
- ZHAO, Zhongwei
- and REIMONDOS, Anna,
https://doi.org/10.3917/popu.1202.0329
Notes
-
[1]
According to officially released statistics, China’s population totalled 660 million at the end of 1958, and 659 million at the end of 1961. There are noticeable inconsistencies in government- reported population growth rates and these population totals, however. For details see Yao and Yin (1994).
-
[2]
Estimated numbers of postponed or lost births vary widely due to the use of different data and assumptions in the estimations. See also Cai and Wang (2009), Li (1997).
-
[3]
There were some changes in provincial territories between 1953 and 1964. The difference between the two sets of population figures was partly affected by these changes.
-
[4]
To compute q0, 4q1 and 5q5, we first computed 4m1 and 5m5, and then converted them to 4q1 and 5q5. Using different methods to compute the probability of dying at these ages could lead to different results, especially during the famine when there were a marked increase in mortality and decrease in fertility.
-
[5]
Some studies have shown that girls given away at birth were sometimes not reported by their parents, and this contributed to the relatively high reported sex ratio at birth (Johansson and Nygren, 1991).
-
[6]
In most surveys conducted in China, retrospective surveys in particular, reported age at menarche tended to be higher than that obtained from other sources or recorded in some other populations. It needs to be interpreted with caution, and deserves further investigation.
The history of humankind is filled with war, epidemics and famine. While the causes of famine are well documented in the literature, their social, health and demographic consequences are less clearly understood. As detailed, reliable data are rarely available, the numbers of deaths, migrants and refugees are often estimated in overall terms. Looking beyond the effects brought to light by individual-level survey data, Zhongwei Zhao and Anna Reimondos reveal the dramatic impact on demographic behaviour of the great famine that swept across China between 1958 and 1961. They also examine the variations in demographic response by place of residence and socio-demographic characteristics. While fertility and marriage rates declined everywhere, and child mortality increased sharply, rural areas were more severely affected than urban areas, and low educated families more than higher educated ones.
1One of the largest famines in human history took place in China half a century ago. This disaster, lasting from 1958 to 1961 in many areas, resulted in a huge number of excess deaths. While the causes, magnitude and profound impacts of this catastrophe have been brought to light in recent decades, many issues about the famine remain to be adequately examined (Ashton et al., 1984; Banister, 1987; Peng, 1987; Kane, 1988; Jowett, 1991; Li, 1997; Riskin, 1998; Chang and Wen, 1998; Yang and Su, 1998; Lin and Yang, 1998; Kung and Lin, 2003; Cao, 2005; Fan and Meng, 2005; Yang, 2008a; Houser et al., 2009). Through further analysis of data collected by China’s 1982 and 1988 fertility surveys, this paper investigates the demographic consequences of the famine and individual demographic responses in some of China’s most severely affected provinces.
I – Demographic consequences of China’s 1958-61 famine and demographic responses
2While China’s great famine is often called “three years of natural disasters”, a notable decrease in per capita grain output and a marked increase in mortality had already been recorded in several provinces in 1958 (Peng, 1987; Johnson, 1998; Riskin, 1998). In that year, the officially reported crude death rate (CDR) was already higher than those for 1956 and 1957, even at national level. By 1959, the famine spread widely throughout the country, and the situation deteriorated further in 1960 (Huang and Liu, 1995). Although a sign of improvement was seen in some places in 1961, when China’s recorded population size was still smaller than that for 1958, a full recovery did not begin until 1962. [1]
3We know that this great tragedy was largely a result of policy failure and mismanagement, although it was exacerbated by poor weather conditions in many areas (Peng, 1987; Kane, 1988; Li, 1997; Chang and Wen, 1998; Lin and Yang, 1998; Yang and Su, 1998; Kung and Lin, 2003; Cao, 2005; Yang, 2008a; Houser et al., 2009). The famine occurred on an unprecedented scale and showed remarkable regional, including urban-rural, variations. The CDR in the worst-hit province was ten times higher than in less affected ones. Severe food shortage and its consequences were generally more devastating in the countryside than in cities. The major impact of this famine, which has profoundly affected China’s political, social, economic and demographic evolution in the last half century, can still be felt today (Song, 2009).
4The widespread starvation and significant reduction in calorie intake during the famine had a devastating impact on population health and led to a sharp increase in mortality (Peng, 1987; Kane, 1988; Jowett, 1991; Houser et al., 2009). Officially reported CDRs rose from 10.8 per 1,000 in 1957 to 25.4 per 1,000 in 1960 (Huang and Liu, 1995). In many counties, the reported CDR reached more than 100 per 1,000. Independent estimates made by various scholars suggested an even greater increase in mortality. According to some studies, the famine was directly responsible for around 30 million excess deaths (Ashton et al., 1984; Coale, 1984; Banister, 1987; Jin, 1993; Cao, 2005).
5The famine also resulted in a huge fertility reduction. China’s reported crude birth rate was 34.0 per 1,000 population and total fertility rate was 6.4 children per woman in 1957, but they fell drastically to 18.2 per 1,000 and 3.3 children, respectively, by 1961 (Yao and Yin, 1994). Available statistics suggest that fertility decline during 1959-1961 led to a shortfall of 15 to 30 million births (Ashton et al., 1984; Li, 1997; Cai and Wang, 2009). [2] Because of the mortality surge and the fertility crash, China recorded its only period of negative population growth since the founding of the People’s Republic in 1949.
6Marked regional variations in the severity of starvation triggered extensive internal migration during and after the famine (Peng, 1987; Kane, 1988). Even according to government records, which are probably incomplete, net population losses caused by migration alone reached 2.6% in Anhui, 2.1% in Shandong and 1.5% in Hunan in 1960 (Zhuang, 1994).
7The famine also caused great distress in many families or destroyed their family life completely. In addition to many widows, widowers, single parent households or orphans produced by the severe mortality, divorce and family division increased markedly during the famine, at least in some areas (Peng, 1987). Under extreme circumstances, children or wives were even sold in a desperate attempt to save other family members from starvation and death (Yang, 2008b).
8Like the discussion presented so far, most available studies of the famine have been based largely on statistics aggregated at national, provincial and, in some rare cases, county levels. They tend to concentrate more on causes, consequences and impacts of the famine rather than on individual demographic responses to this disaster. Many questions about the famine remain to be adequately answered.
9For example, we know the short-term demographic consequences of the famine reasonably well, those observed at national or provincial level in particular. However, our knowledge of its long-term demographic impacts is limited, although a few studies, focusing mainly on the long-term health impact of the famine, have been published in the last few years (Luo et al., 2006; Chen and Zhou, 2007; Song et al., 2009; Wang et al., 2010). We know that the famine caused huge loss of life, but with the exception of some limited observations on urban-rural mortality differentials made at national and provincial levels, we do not know in detail how mortality varied among people with different socioeconomic characteristics. We know that fertility fell sharply during the famine period, but we do not know the extent to which this reduction was caused by deliberate fertility control rather than being affected by other changes such as hunger-induced poor health or infertility, separation of spouses, or postponement of marriage (Jowett, 1991). Moreover, if intentional fertility control did exist, who, under what circumstances, was more likely to have delayed or stopped childbearing? Briefly, while we have reached some conclusions about the famine with reasonable confidence, detailed demographic evidence that would provide stronger support for these conclusions and further enrich our knowledge is still limited. Although a number of researchers have recently studied some of the issues discussed above (Cai and Wang, 2009; Song, 2009), investigations specially designed to examine these questions are still difficult to find.
II – Research questions, data and methods
10This paper aims to fill some gaps in our knowledge about the demography of China’s great famine. By analysing demographic data collected from millions of people, the study intends to provide further insights on changes in marriage, mortality, fertility and pregnancy outcomes during the famine period. The investigation focuses on the demographic impact of the famine and individual demographic responses, especially their variations across different population groups. The impact of famine on migration and household composition will not be examined in this paper because of limited data availability.
11This study uses data collected by China’s 1982 National One-Per-Thousand Population Sample Survey on Fertility and the 1988 National Sample Survey on Fertility and Contraception. The first survey employed a stratified, clustered, proportional sampling design. It surveyed more than 310,000 women aged 15-67 in 1982 who lived in 28 provinces, autonomous regions and metropolitan areas administered directly by the central government. The second survey, also referred to as the 1988 Two-Per-Thousand Fertility Survey, used a stratified, systematic, clustered, non-proportional sampling procedure. It was conducted in about two-per-thousand of the national population selected from all provinces in mainland China. Nearly half a million ever-married women aged 15-57 in 1988 were interviewed.
12Both surveys obtained detailed information about fertility history for ever-married women. The 1982 survey recorded all children for selected women and the survival status of these children at the time of the survey. The total number of reported children was just over 830,000. The 1988 survey recorded every pregnancy and its outcome (around 1.5 million in total) for ever-married women. It also provided information on the survival status of recorded children and date of death if they had died before the survey date. In addition, the two surveys collected other useful information such as age at first marriage, educational level, occupation, area of residence, age at menarche and duration of breastfeeding for all selected women (the last two items were included in the 1988 survey only). Since a considerable number of surveyed women experienced the 1958-1961 famine and many of their children were born in this period, the survey data offer a unique opportunity for an in-depth study of the demography of China’s great famine. These data are free from the impact of deliberate cover-up, which was widely observed in some other data sources both during or after the famine.
13The 1982 and 1988 fertility surveys are among the best demographic surveys ever conducted in the world. China took a population census in 1982. Its net under-enumeration rate was 0.15 per 1,000 according to the post-enumeration survey. The under-enumeration rate of children born in 1981 was higher, but only 1.83 per 1,000 (Census Office of the State Council and Division of Population Statistics of the National Bureau of Statistics, 1982), a much lower rate than those recorded in American and Japanese censuses carried out at the time, which varied between 4 and 9 per 1,000 (Lin and Wang, 1991). Following the census, the Chinese government conducted the one-per-thousand fertility survey. The survey quality was again very high, as evidenced by the systematic examinations performed by Li (1984) and Coale (1984). After his very careful study, Coale concluded that “with some minor exceptions” the fertility and nuptiality information taken from the 1982 census and fertility survey “can be accepted as of high quality; as such, they provide the basis for a valid history of recent trends in China” (Coale, 1984, p. 38).
14Six years later, the Chinese government took another large fertility survey, the 1988 two-per-thousand fertility survey. As reported by Zhao (1989), 99.95% of sampled individuals participated in the survey. The post-enumeration check-up reported an error rate of 1 per 1,000 (Zhao, 1989). Lin and Wang systematically compared the 1988 survey results with those of the 1982 census and fertility survey. They also concluded that these results were very consistent and that the quality of the two-per-thousand fertility survey was high (Lin and Wang, 1991). Of course, data collected through retrospective surveys may be affected by recall errors and some children may have been missed out in the enumeration. Parts of Lin and Wang’s comparison showed that this may have some impact on recorded fertility levels for the early period, though probably relatively small. As commented by Lavely, the quality of China’s 1982 census and of its fertility survey data was high. The net census error of 0.015% was unprecedentedly low. “Although there are grounds for scepticism that error rate could truly be this low – a rate 100 times high would still be good” (Lavely, 1987, p. 168).
15However, when these fertility survey data are used to investigate the demographic consequences of the famine, the study may be affected by certain types of selection biases. Such biases arise from systematic differences in mortality and fertility between families where at least one woman survived to the time of the survey and those where all women of the same birth cohorts had died before the survey. Because the fertility of recorded women is likely to have been higher than those who were no longer living at the time of enumeration, and because the survival of children may be related to that of their mother, especially during the famine, results obtained from the sample may not represent what actually happened to the entire population during the famine. These results are probably among the most reliable quantitative evidence we can obtain, however. They can be used as important references for the mortality and fertility impact of the famine for the study areas.
16Also, because of the retrospective nature of the surveys, the information collected on women’s education, occupation, place of residence and various other characteristics reflects their situation at the time of enumeration, which may differ from their situation at the time of the famine or when certain demographic events took place. This could affect the accuracy of the results when the association between these factors and past demographic changes is examined. Before 1988, when the second survey was undertaken, changes in women’s education, occupation, and urban/rural residential status were relatively small after their marriage, in many rural areas in particular. For this reason, the impact of such status changes on our study is expected to be moderate or small.
17Another concern of the study is the sample size. While the two surveys are among the largest fertility surveys ever conducted, when the sampled population is divided by provinces, cohorts or years when a certain demographic event took place, the number of people in each sub-group is still relatively small. When marriage or fertility patterns of the early years are examined, women included in the surveys, especially the 1988 survey, can only provide a representative sample for women of a limited age range. This is a major reason why data collected by both fertility surveys were examined in the study and why only women of certain age groups were included in some analyses.
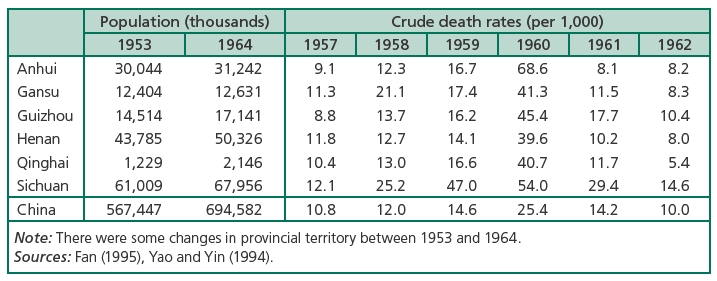
18This study concentrates on the demographic consequences of the famine and individual demographic responses in Anhui, Gansu, Guizhou, Henan, Qinghai and Sichuan provinces (Figure 1). These six provinces accounted for more than a quarter of the national population both before and after the famine (Table 1), and were among those most hard-hit by this disaster according to officially reported CDRs. [3] In comparison with the levels recorded in 1957, mortality in the national population increased by 135% in 1960, while mortality in the six selected provinces increased by 236% (Henan) to 654% (Anhui). This conclusion is largely consistent with the comparisons made by Peng (1987) and Houser et al. (2009). The decision to select these six provinces arises mainly from the consideration that demographic impacts of the famine and individual demographic responses would be more observable under severe famine conditions. Whenever it is useful, however, we will briefly compare the results obtained for the six provinces with those for the whole country.
Figure 1

Figure 1
Map of China in 1980 and geographical location of the six selected provinces19Both conventional and non-conventional demographic methods are used in this study to compute major fertility, mortality and marriage statistics from the data collected by the two fertility surveys. In addition, regression analysis is used to examine differences in fertility, mortality and marriage patterns among various population groups and major factors that associate closely with such variations. Since the 1988 fertility survey used a non-proportional sampling procedure, both its weighted and un-weighted data were analysed, although only weighted results are presented in the paper.
III – Marriage
20In this section, changes in marriage patterns are investigated by examining probabilities of marriage in selected age groups during the study year among women who were not married at the beginning of the year and proportions of women who were ever-married by a given age. In calculating these statistics, women’s age at the end of the year is used for the convenience of discussion. These indicators were chosen because they reveal the famine impact more clearly than other measurements, for example total first marriage rate.
21Marriage was practically universal among Chinese women in the past. Before 1970, age at first marriage was relatively low and around 95% of women were married by age 25. A major impact of China’s great famine was to make marriage more difficult, so many marriages were postponed during this period. This is evident in Figure 2, which shows probabilities of marriage in various age groups among women who were not married at the beginning of the year over the period 1956-1965. This and the next figure present only the results obtained through the 1988 fertility survey; the results of the 1982 survey show very similar patterns.
Recorded population size and crude death rates in the six provinces in selected years
Recorded population size and crude death rates in the six provinces in selected years
22As shown in Figure 2, changes in women’s probability of marriage at ages 15 and 16 were relatively small before 1963, including during the famine period. This was likely due to the fact that women marrying at these young ages were affected more by the tradition of early marriage, and thus maintained a relatively strong propensity to marry even at a time of hardship. In other age groups, changes in marriage behaviour are more visible during and after the famine. In 1958, probabilities of marriage had already started to fall in some age groups. This was more notable in Anhui, Gansu and Sichuan provinces. This downtrend continued in 1959, when probabilities of marriage in most of the listed age groups reached their lowest level in the study period. In 1960, the probabilities remained low in most age groups although they were higher than those recorded in 1959 in a few age groups. In comparison with the trends indicated by the total first marriage rate, which had already returned to its pre-famine level in the six provinces in 1960, this analysis suggests that the impact of the famine on marriage behaviour was more severe and lasted for longer. Probabilities of marriage recovered to their 1957 levels in many age groups in 1961. They continued to rise and reached a new peak in 1962 and 1963, because women who could not marry during the famine while they were young now married at slightly older ages.
Figure 2

Figure 2
Probability of marriage for women at given ages, six selected provinces, 1956-196523The above conclusion is supported by Figure 3, which displays the percentage of ever-married women by a given age over the period 1956-1965. As shown earlier, the impact of the famine on women who married before age 18 was small. In contrast, proportions of ever-married women at ages 18-23 all showed a notable trough in the period 1958-1961, due mainly to the postponement of marriage observed in many age groups during this period. By 1962, and in some age groups by 1963, the lag impact of the famine on the proportion ever-married became less observable as the cumulative percentages of married women returned to their pre-famine levels. They then started to decline again in the mid-1960s, due primarily to a further increase in age at marriage.
Figure 3

Figure 3
Percentage of women ever-married by age, six selected provinces, 1956-1965IV – Reproductive behaviour and fertility
24Individual reproductive behaviour and fertility also changed markedly during the famine. One of the most significant changes was the drastic fertility reduction, as already indicated by the national figures cited earlier. This change is further revealed by the decline in the truncated total marital fertility rate (TMFR) and total fertility rate (TFR) for women aged 15-24. Use of the truncated TMFR and TFR is again due to the constraint imposed by data availability. While the TMFR and TFR for this age range are markedly lower than, and thus cannot represent, the fertility of women of all reproductive ages, they are very effective in showing the magnitude of fertility decline in comparable age groups over a longer period.
25Figure 4 shows TMFRs and TFRs for women aged 15-24 in years 1956-1965 computed from the 1988 survey data. As the 1982 survey results are almost exactly the same, they are not presented here. Both TMFR and TFR started to decline in the study population in 1958. Our detailed examination shows that in the second half of 1958, monthly fertility rates among women aged 15-24 were already notably lower than those observed in the same months in 1956 and 1957. This suggests that conception rates had already fallen in the last quarter of 1957. An even sharper reduction in the truncated TMFR and TFR was observed in 1959 and the trend continued over the next two years. In 1961 the TMFR and TFR bottomed out at less than 40% of the levels recorded in 1957.
Figure 4

Figure 4
Changes in TFRs and TMFRs for women aged 15-24, six selected provinces, 1956-196526According to these annual fertility indicators, the fertility downturn reversed in 1962, when the TMFR and TFR for women aged 15-24 rose to more than double those recorded for 1961, reaching levels close to those observed in 1958. The monthly data show that marital fertility returned to its pre-famine level in mid-1962, suggesting that conceptions had recovered to the level recorded in 1956 and 1957 by late 1961, very close to the time of full recovery in marriage. A fertility rebound took place in 1963, with both truncated TMFR and TFR reaching record levels. This was partly attributable to the “compensation” effect: women who had delayed their reproduction during the famine now speeded up childbearing in order to make up their fertility loss. By 1965, the large fertility fluctuations of the famine and post-famine period had ended and the truncated TMFR and TFR fell back to their pre-famine levels.
27The sharp fertility reduction was also revealed by changes in period parity progression ratio (PPPR), which measures the proportion of women who go on to have another child after having already had a certain number. Figure 5 shows PPPRs for years 1956 to 1965 computed from the 1982 fertility survey data. To calculate the PPPR for any year requires information on women’s fertility history over the previous ten years. We chose to use 1982 survey data because they provide the required information for women born in earlier years and so are more suitable for the analysis than the 1988 survey data. According to our results, most of the PPPRs already showed a slight decrease in 1958, but the fall was more visible in the next three years. One of the most important findings shown in this figure is that greater reductions in PPPRs were recorded among women who already had a larger number of children than those with a smaller number. For example, over the period 1957-1961, the progression ratio from parity one to two decreased from 0.97 to 0.75, while from parity four to five it fell from 0.94 to 0.52. We have not presented PPPRs for women who already have five or more children in the figure because of the small number of births used to compute them.
28During the famine period, changes in fertility behaviour are evidenced not only by the fall in truncated TMFRs, TFRs and PPPRs, but also by the increase in birth intervals. In comparison with the pre-famine period, the birth intervals of women who gave birth in 1960-1962 were relatively long. This was related to the fact that many women who had postponed childbearing in 1958 and 1959 resumed their reproduction in subsequent years. According to our analysis, the interval between marriage and first birth for women aged 15-24 with a first birth in the period 1960-1963 was longer than that recorded in 1956-1959. The interval between first and second birth, and between second and third births for women of the same ages also increased notably over the period 1960-1962. In the next two years, these birth intervals fell back to or below their pre-famine levels.
29Changes in reproductive behaviour and fertility varied considerably among women with different demographic characteristics during the famine and post-famine period. As already shown in Figure 5, when the PPPR declined, it generally fell more for women who already had more children than for women with fewer children; this is supported by the national figure published by Feeney and Yu (1987). Furthermore, the change in PPPRs was also related to the sex composition of children already born. In the six provinces, the fall in PPPRs among women who already had both sons and daughters was generally greater than for women with same number of children but only sons or daughters. The lowest fertility reduction was recorded among women who had only surviving daughters. These patterns are revealed more clearly by national data because their larger sample size helps to reduce the random variations resulting from small numbers of observations (Figure 6). This conclusion is also supported by other studies (Zhao, 1997a; Hao and Gao, 1997).
Figure 5

Figure 5
Changes in period parity progression ratios, six selected provinces, 1956-196530Differences in women’s reproductive behaviour were also observed in the immediate post-famine years. Partly because of a stronger tendency to postpone the next birth among women who already had a large number of children than those who did not, changes in birth intervals also varied notably. For example, the interval from marriage to first birth increased from 2.2 years in 1956 and 1957 to 2.6 years in 1962. In the same period, the intervals from the first to second and from second to third birth increased from around 2.3 years to 3.2 years. It is also notable that in 1962, when the fertility recovery started to accelerate, marital fertility rates for women aged 20-24 recovered more quickly and reached a relatively high level in comparison with that recorded among women aged 15-19.
Figure 6

Figure 6
Changes in period parity progression ratios by sex composition of children already born, China, 1956-1965V – Mortality
31While both the 1982 and 1988 fertility surveys collected information on mortality, the 1982 survey only recorded survival status of every child at the time of the enumeration. Our analysis of mortality changes thus has to be based mainly on mortality data obtained from the 1988 survey. We compared proportions of children surviving to June 1982 in the sampled populations recorded by the two surveys in the six provinces. The results are very consistent (in most cases the difference is less than 1%) for people born between 1950 and 1970. However, according to the 1988 fertility survey, the proportions of people born in 1951 and 1961 who survived to June 1982 were 4.0% and 4.7% higher, respectively, in comparison with those enumerated by the 1982 survey.
32The 1988 survey results show a marked increase in infant and child mortality during the famine period. As shown in Figure 7, infant mortality was below 120 per 1,000 in 1957. [4] It rose to about 160 per 1,000 in 1958, and to more than 218 per 1,000 in 1959 and 228 per 1,000 in 1960 before falling back to 156 per 1,000 in 1961, still notably above the average of 1956 and 1957. Starting from 1962, infant mortality in the study population dropped to below 100 per 1,000.
Figure 7

Figure 7
Changes in infant and child mortality, six selected provinces, 1956-196533Similar changes occurred in the probability of dying between ages 1 and 4, which stood at around 110 per 1,000 in 1957 in the six provinces. In 1958 when the famine started, it rose sharply to more than 160 per 1,000, exceeding the level of infant mortality. It peaked at 176 per 1,000 or higher in 1959 and 1960 when the famine was at its worst, before falling back to the pre-famine level in 1961. In the next few years, the probability of dying between age 1 and 4 showed a continuous decline. During the period 1958 to 1960, a notable increase was also observed in the probability of dying between ages 5 and 9 (especially among girls), although mortality in this age group was much lower than among the under-5s.
34As mentioned earlier, if data collected through retrospective fertility surveys are used to study mortality changes during the famine, mortality levels may be underestimated. This is because the risk of dying in families where at least one woman survived up to the year of the survey is very likely to have been lower than in families where women of the same birth cohorts all died during the famine. However, even these data show a considerable increase in mortality during the famine years. In a hypothetical birth cohort that experienced the infant and child mortality recorded in the six provinces in 1957, 76% of members would have survived to age 10. But under the mortality conditions observed in 1958, 1959, 1960 and 1961, the proportion of surviving hypothetical cohort members would have fallen to 67%, 59%, 60% and 73%, respectively. Under mortality conditions similar to those recorded in 1959 and 1960, 40% or more of the cohort would have died before reaching age 10, a proportion close to that given by the Coale-Demeny model life table, region north, females, level 6. If mortality levels in other age groups of the study population were also close to those given by this mortality model, then the life expectancy at birth for the population would be around 32.5 years (Coale and Demeny, 1983).
35Our analysis of cohort mortality changes further shows that the probability of surviving to age 10 was rather low (between 67% and 72%) for people born in 1958, 1959 and 1960, but increased to 79% for those born in 1961, which was well above the probability for people born between 1956 and 1960. These results suggest that infant and child mortality had already increased markedly in the six study provinces in 1958, and its level was considerably higher than that recorded in 1961.
36Figure 7, which shows probabilities of dying for male and female children, also indicates that sex ratios of infant mortality were greater than 1 in both pre- and post-famine periods, but that they were close to 1 in 1958 and even lower than 1 in 1960-1961. This seems to suggest that infant mortality was slightly biased toward females during the famine in comparison with the pre-famine period. Among children aged 1-9, mortality was higher for females than for males in most of the years under observation. This was particularly notable in the probability of dying between ages 1 and 4 in 1959-1960 and 1962-1964, and in the probability of dying between ages 5 and 9 in 1958-1959. Our analysis of cohort mortality has further shown that while infant mortality was generally higher for males than for females, probability of dying between ages 1 and 4 was consistently higher for females than for males in the period under observation. Mortality differentials of this kind are most likely to reflect preferential treatment of sons over daughters, a common practice in many historical Chinese populations (Zhao, 1997b; Lee et al., 1994).
VI – Pregnancy outcomes and fertility determinants
37In addition to the fertility and mortality changes examined in previous sections, levels of stillbirth, spontaneous abortion and induced abortion, patterns of breastfeeding and age at menarche changed notably during the famine. Many of these demographic events are conventionally referred to as proximate determinants of fertility because they can directly affect its level. This section examines these changes on the basis of the outcomes of nearly 50,000 pregnancies recorded by the 1988 fertility survey among women aged 15-29 in the period 1956-1965.
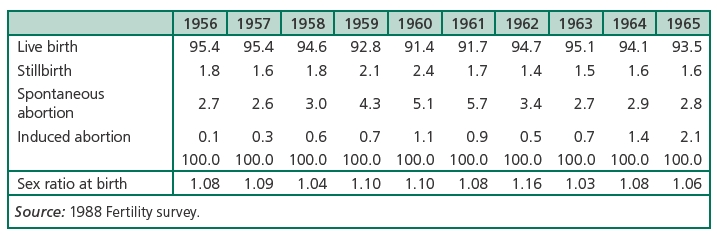
38One of the most notable impacts of the famine on pregnancy outcomes was a reduction in the proportion of live births, as shown in Table 2. More than 95% of recorded pregnancies led to live births before 1958, but the proportion fell to less than 92% in 1960 and 1961. The famine triggered not only an increase in infant and child mortality, but also a rise in stillbirths and spontaneous abortions, which was closely related to women’s poor health. According to the survey results, an average of 1.7% of pregnancies ended in stillbirths in 1956 and 1957, rising to 1.8% in 1958, 2.1% in 1959 and 2.4% in 1960. Similarly, 2.7% of pregnancies, on average, were reportedly terminated by spontaneous abortions over the years 1956, 1957 and 1963-1965, compared with 3.0%, 4.3%, 5.1%, 5.7% and 3.4% over the five years from 1958 to 1962.
Percentage distribution of pregnancy outcomes for women aged 15-29, six selected provinces, 1956-1965
Percentage distribution of pregnancy outcomes for women aged 15-29, six selected provinces, 1956-1965
39Induced abortions also showed a marked increase during the famine though their level was very low because abortion as a means of controlling unwanted births was neither acceptable nor readily available at the time. Only 0.1% of pregnancies were terminated by induced abortion in 1956 and 0.3% 1957; but the proportion rose to 0.6% in 1958, 0.7% in 1959, 1.1% in 1960 and 0.9% in 1961. In the next two years, induced abortions fell back to 0.5% and 0.7%, before climbing again to 1.4% in 1964 and 2.1% in 1965. Since then, induced abortion has increasingly become acceptable and also been used widely in recent family planning programmes to control the number of unwanted births. While changes in the magnitude of stillbirths and spontaneous abortions were largely a result of women’s poor health caused by hunger, the rise and fall in induced abortions were at least partly affected by people’s intentions. Deliberate manipulation of pregnancy outcomes was also suggested by changes in reported sex ratio at birth. In comparison with most of the pre- and post-famine years, the male to female ratio of recorded live births increased slightly in the famine and the year that followed, reaching 1.10 in 1959 and 1960, and 1.16 in 1962. These ratios were notably higher than what would be expected under normal conditions. Two explanations, among others, for this irregular pattern are female infanticide and the practice of giving away baby girls for adoption, [5] both of which have been observed in some historical or even contemporary Chinese populations (Johansson and Nygren, 1991; Lee et al. 1994; Zhao, 2006).
40In addition to the factors discussed above, the famine strongly affected two other proximate determinants of fertility, age at menarche and breastfeeding. The 1988 fertility survey data revealed that during the famine, many women reached physical maturity later than in normal years. The proportions of women who already had menarche by age 16, 17 or 18 all showed a notable decline over the period 1958 to 1964, indicating that the deterioration of women’s health had already started to affect the timing of their menarche from at least 1958. These proportions did not recover to their pre-famine levels until 1965. For example, in 1957, 52% of women had already had menarche at age 16, 70% at age 17 and 86% at age 18. But in 1961 the proportions dropped to their lowest levels recorded over the study period: 39% at age 16, 57% at age 17, and 75% at age 18. Because of this delay, reported mean age of menarche increased notably for women born between 1941 and 1950, reaching age 15 between 1956 and 1965. [6]
41In the 1950s and 1960s, the proportion of mothers who breastfed their children (regardless of duration) was very high, reaching 98% in the study areas. The proportion decreased slightly in 1958, 1959, 1960 and 1961, by 1-2% with respect to the levels recorded either before or after these years. At a time of severe food shortage one would expect all mothers to breastfeed their babies whenever possible, although they may have less milk than in normal years. This may explain the small change observed. The proportion of women who breastfed their children for four or more months was lower than the proportion who breastfed their newborns. The proportion varied between 87% and 89% in non-famine years and fell notably during the famine period. Around 87% of mothers breastfed their children for at least four months in 1956 and 1957, but only 81% in 1959 and 80% in 1960. These results were highly consistent with the increase in infant mortality in these years, although they might also result from the poor health of the mothers, which may have prevented them from breastfeeding their children.
VII – Demographic consequences of the famine and individual responses in populations with different socio-demographic characteristics
42We now turn to another important question: were the demographic consequences of the famine and individual demographic responses the same across populations living in different areas or with different socio-demographic characteristics? To examine this question, a series of logistic regression analyses were conducted. The 1982 and 1988 fertility surveys were not specifically designed to study the demography of the famine and did not record certain data that are important for such studies. The regression analyses could only be applied to variables included in the data collection. For these reasons, the analyses may not be as informative as we had hoped. They nonetheless shed further light on the relationship between demographic changes in the famine period and certain social demographic characteristics, after controlling for the impact of various other factors.
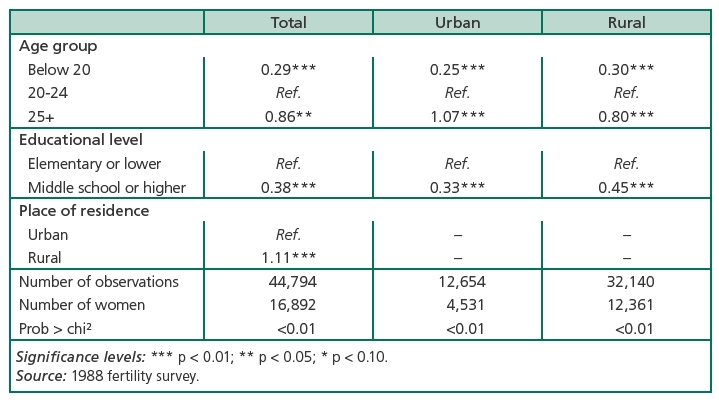
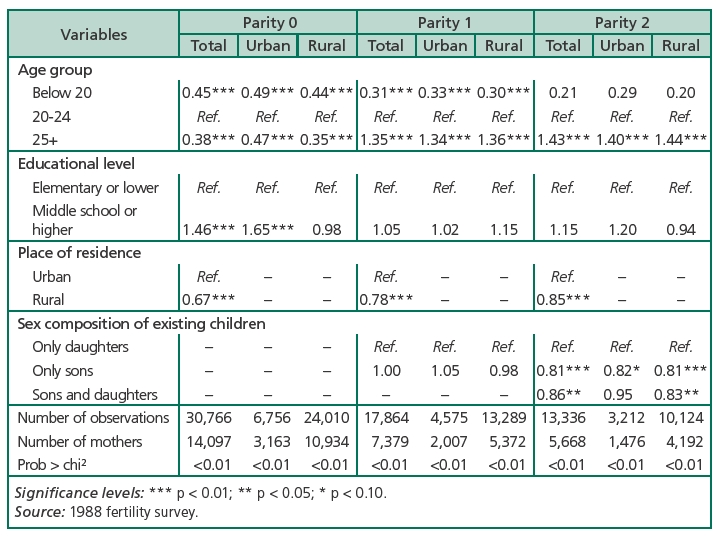
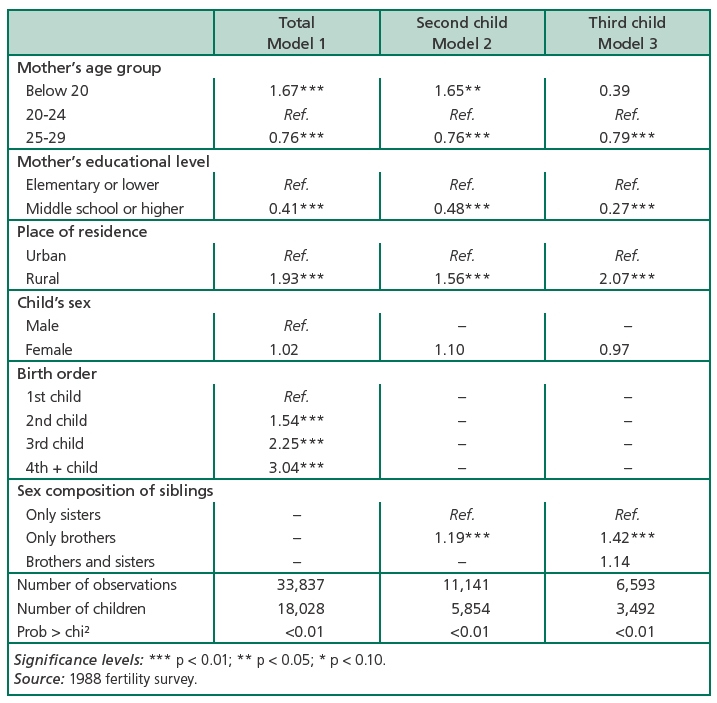
43Our analyses concentrated particularly on variations in marriage, fertility and mortality among different population groups over the period 1958-1961. We ran three sets of logistic regressions, with marriage, giving birth, or dying as the response variable in each of them, respectively. In the analysis of the likelihood of marrying, predictor variables include a woman’s age, educational level and area of residence. In examining the chance of giving a birth, sex composition of children already born is also included as a predictor variable. In analysing the probability of dying in infancy and early childhood (ages 0-2), in addition to mother’s age, educational level and area of residence, we consider the impacts of the parity and sex of the children, and sex composition of their surviving siblings. The logistic regression results are presented in Tables 3, 4 and 5 respectively.
44These results and our other analyses reveal remarkable differences between urban and rural areas in the demographic consequences of the famine and individual demographic responses to it. During the period 1958-1961, the rural population was more severely affected. While infant and early childhood mortality in urban areas remained stable or rose slightly in this period, it increased much more strongly in rural areas (Table 5). Similarly, the famine had a stronger impact on rural fertility, with a lower likelihood of giving birth in rural areas than in urban ones (Table 4). While the likelihood of marrying was affected in both urban and rural areas, rural women, after controlling for other covariates, were more likely to marry than their urban counterparts during the famine years (Table 3). This might be partly attributable to the strong tradition of early marriage in rural areas.
45Our analysis also reveals that women with a higher level of education, after controlling for other covariates, were less likely to marry during the famine than those with a lower level of education (Table 3). However, as shown in Table 4, among childless married women, those with a higher level of education were more likely to have give birth than their less educated counterparts (mainly in urban areas). Women’s educational levels were also closely related to the risk of death of their young children. The mortality of children whose mother had a higher level of education was lower than that of children whose mothers had an elementary or lower level of education (Table 5). The slightly higher fertility among women with a comparatively high level of education may be due to the fact that their families had a relatively high standard of living or were less affected by the famine. This is suggested by the lower infant and early child mortality observed in these families.
Likelihood of marriage for women aged 15-29, six selected provinces, 1958-1961 (odds ratios from logistic regressions)
Likelihood of marriage for women aged 15-29, six selected provinces, 1958-1961 (odds ratios from logistic regressions)
46Our logistic regression results further suggest that variations in the levels of fertility and infant and early child mortality were closely related to the number and sex composition of children already born in the families. Among women who already had two surviving children, those with only sons or with both sons and daughters were less likely to have another child than those with only daughters, and this was particularly observed in rural areas. These results support the findings presented in section four. The results shown in Table 5 also show that children of higher birth order were more likely to die than those of lower birth order, and this might be partly attributable to their relatively short birth intervals. Moreover, among children with one surviving sibling, those with an elder brother were more likely to die than those with an elder sister. Among those with two surviving siblings, children with two elder brothers were more likely to die than those with two sisters. These results imply that in addition to the impact of poor nutrition and adverse health conditions which tended to affect the chances of conception and foetal survival, intentional control of fertility or family size and differential treatment of sons and daughters played a part in the formation of different fertility and mortality patterns across various population groups.
47Our analysis also found that during the famine period, women in rural areas were more likely to marry at ages 20-24, and their urban counterparts at ages 25-29 (Table 3). Women were more likely to have their first birth at ages 20-24, and their second or third birth after age 25 (Table 4). After controlling for other factors, there was a negative relationship between mother’s age and infant and early child mortality. Mortality among children with a mother aged 25-29 was lower than among those with a younger mother (Table 5).
Likelihood for women aged 15-29 of having a(nother) child, six selected provinces, 1958-1961 (odds ratios from logistic regressions)
Likelihood for women aged 15-29 of having a(nother) child, six selected provinces, 1958-1961 (odds ratios from logistic regressions)
Probability of dying at ages 0-2, six selected provinces, 1958-1961 (odds ratios from logistic regression)
Probability of dying at ages 0-2, six selected provinces, 1958-1961 (odds ratios from logistic regression)
48Admittedly, some of the demographic or behavioural patterns reported above were not only observed in the Chinese population or during famine years, but are also found in other populations or in other time periods. These differentials might be the result of variations in economic development, differences in living standards or the long-term impact of culture and tradition. It is noteworthy, however, that some of the reported findings, such as the lower fertility observed in rural areas, the greater likelihood of having children among women with better education, the increasing differences in levels of mortality at different birth orders, the wide gap in infant and early childhood mortality rate between urban and rural populations and the higher mortality among children with a relatively large number of surviving brothers, all reflect the considerable influence of the famine. These demographic changes and patterns, as well as their underlying causes, deserve further investigation.
Conclusion
49The closer examination of China’s 1958-1961 famine presented in this paper has uncovered further evidence that the famine had catastrophic demographic consequences. Despite the potential bias arising from the use of retrospective survey data, as discussed in Section II, our analysis has revealed that marriage, fertility, mortality, pregnancy outcomes, and indeed almost every aspect of people’s life were severely affected during the famine period. The famine led to one of the greatest human tragedies in China’s recent history and profoundly changed the course of social, economic and political development in the early decades of the People’s Republic.
50This study is largely based on the 1982 and 1988 fertility survey data collected from the six selected provinces. Some readers may naturally want to find out that how demographic changes in these provinces differed from those observed in the country as a whole during the famine. We have conducted a systematic comparison and the major conclusions are summarized below.
51Demographic changes of the same nature as those recorded in the six provinces were observed throughout China over the period 1956-1965. The probability of marrying and the proportion of ever-married followed a similar age pattern in the six provinces and the whole country. However the decline in marriages in famine years and the subsequent recuperation were stronger in the six provinces than in the national population. Similarly, in the six provinces the truncated TFRs for women aged 15-24 were almost the same as that recorded in the whole country in 1956 and 1957. But in the years 1959-1961, they were marginally above 1.0 in the national population but stood at just 0.76 in the six provinces. After the famine ended, the truncated TFR for the six provinces was slightly higher than the national figure over the years 1963-1965. For the truncated TMFR, the comparison results were broadly similar, although they were slightly lower for the six provinces than the national figures both before and after the famine. During the famine years, the gap in marital fertility between the six provinces and whole country increased notably. The comparison of PPPRs between the six provinces and whole country showed similar results. During the famine, patterns of changes in PPPRs in the six provinces were very similar to those in the national population, but their decline was sharper. For example, from 1957 to 1961 the progression ratio from the fourth to fifth child decreased from 0.93 to 0.65 in the whole country, but from 0.94 to 0.52 in the six provinces. Changes in the patterns of infant and child mortality in the six provinces over the study period were also similar to those found in the national population, although the magnitude of mortality increase was far greater in the six provinces during the famine. In 1959 and 1960, for example, reported average infant mortality rose to more than 220 per 1,000 in the six provinces versus approximately 130 per 1,000 in the national population. Child mortality changed in a similar manner. It should be noted that the pre-famine mortality level was somewhat higher in the six provinces compared to the country as a whole. Nevertheless, the increase in infant and child mortality in the six provinces was significantly higher than the average for the whole country.
52Two conclusions can be drawn from the above comparison. First, compared with the whole country, the six selected provinces were indeed more severely affected by the famine. This can be seen in every demographic aspect examined in this study. Second, the famine was a nationwide disaster. Its demographic consequences were felt throughout China, although to a lesser extent in many areas than in the six study provinces.
53The study has provided further evidence that a notable decrease in marriage and fertility rates and an increase in infant and child mortality rates were already occurring in many parts of China as early as 1958. The causes of these changes, however, have not yet been adequately examined. Although a few studies have indicated that a drop in food supply was recorded in a few provinces in 1958, some studies have suggested that China had a bumper harvest in that year (Ashton et al., 1984; Peng, 1987; Chang and Wen, 1998; Riskin, 1998; Lin and Yang, 2000). Even in the provinces where the food supply declined, the true impact of this factor in bringing about such dramatic demographic change needs to be further investigated. If it was not the poor weather or poor harvest, then mismanagement and failed policies must be blamed for these changes. If so, how did they produce such catastrophic effects? A number of studies have pointed to the impact of a drastic reduction in food availability caused by over-procurement or the export of large amounts of grain to central government or other provinces, the large-scale mobilization of peasants for constructing backyard furnaces, irrigation and other labour intensive projects, and the widespread introduction of communal dining halls and the attendant mismanagement of food consumption (Lin and Yang, 1998; Chang and Wen, 1998; Yao, 1999). Our analysis also indicates that rural populations experienced far more demographic losses than their urban counterparts during the famine. This reflects the influence of government policies and certain social and economic institutions which may help to either alleviate or aggravate the impacts of famine or disasters of this kind, as suggested by Sen (1981) and other researchers (Kung and Lin, 2003). During China’s great famine, urban dwellers were better protected and were less affected by the nationwide food shortage, but this was achieved at the cost of sacrificing the interests of the rural population (for example, through heavy or unrealistic taxes and over-procurement imposed in rural areas). The suggestions made above are important for a full understanding of the causes of the famine. They have not been adequately examined, however, and further research efforts are required.
54A further major finding is that when the population was struck by the famine, people were not only influenced passively by the severe food shortage. They changed their demographic behaviour accordingly in order to prevent further deterioration in living conditions and to protect their families or certain family members. These changes included postponing their marriage, slowing down their childbearing and, under extreme circumstances, manipulating their pregnancy outcomes. Moreover, when people altered their reproductive behaviour, such changes were often related to the number and sex composition of children they already had. This was a clear indication of deliberate control of fertility or family size. Such deliberate control was at least one of the most important causes of the dramatic fertility reduction recorded in the famine period.
55The confirmation that many people intentionally controlled their reproduction and family size during the famine has a significant theoretical implication. There are many divergent views about whether people could control their fertility or family size in the past, either in normal times or during famine. When commenting on the fertility reduction during the Chinese famine, for example, MacDonald suggested that “the drop in births was the result of factors such as postponement of marriage, spousal separation, reduced fecundity, and increased spontaneous abortions and stillbirths” (2003, p. 389). Jowett also believed that falling fertility observed during famines was most likely to have resulted from “famine induced infertility rather than a large increase in the use of contraception or other causes which are age and parity specific” (1991, p. 139). In contrast, Caldwell and Srinivasan believed that the major cause of the decline was probably due to “sexual abstinence and abortion, supplemented perhaps by an increased use of withdrawal. The mechanisms involved in the reactions to famine are probably known to millions of villagers around the world, but social scientists have conspicuously failed to throw much useful light on the matter” (1984, p. 74). Similarly, in debating reproductive behaviour in Chinese history, some researchers have suggested that Chinese people were able regulate their fertility or family size in the past (Campbell et al., 2002; Zhao, 1997a and 2006), while others have claimed that “whatever the reason for moderate fertility in China, it was not deliberate fertility control” (Wolf, 1985, p. 177).
56At the start of China’s great famine, the People’s Republic was only about ten years old. In many respects, China’s economic development was largely unchanged with respect to pre-1949 levels. Fertility regimes and marriage patterns were quite similar to those of the pre-transitional period, although mortality decline was already well advanced by 1957. At the time, there was no government-led family planning and most people had never heard of modern contraception. It was under such conditions that China’s great famine took place. Individual demographic responses to the famine provide further evidence that in a society similar to that existing before the demographic transition, people consciously sought to control their family size or fertility. When facing hardship they could change their demographic behaviour accordingly. People may have done the same under similar circumstances for many centuries. If this is indeed the case, contemporary understanding of past demographic regimes, based largely on the assumption that deliberate fertility control did not exist in the past, would need to be re-examined.
Acknowledgement: The authors would like to acknowledge the partial support provided by the Australian Centre on China in the World at the Australian National University.
References
- Ashton B., Hill K., Piazza A., Zeitz R., 1984, “Famine in China, 1958-61”, Population and Development Review, 10(4), pp. 613-645.
- Banister J., 1987, China’s Changing Population, Stanford, Stanford University Press, 508 p.
- Cao S., 2005, “The deaths of China’s population and its root cause during 1959-1961”, Chinese Journal of Population Sciences, (1), pp. 14-28.
- Cai Y., Wang F., 2005, “Famine, social disruption, and involuntary fetal loss: evidence from Chinese survey data”, Demography, 42(2), pp. 301-322.
- Cai Y., Wang F., 2009, “Reproductive consequences of China’s Great Leap Forward Famine”, paper presented to International Union for the Scientific Study of Population - International Seminar on Demographic Responses to Sudden Economic and Environmental Change, Chiba, Japan, May 21-23.
- Caldwell J C., Srinivasan K., 1984, “New data on nuptiality and fertility in China”, Population and Development Review, 10(1), pp. 71-79.
- Campbell C., Wang F., Lee J., 2002, “Pretransitional fertility in China”, Population and Development Review, 28(4), pp. 735-750.
- Chang G., Wen G., 1998, “Food availability versus consumption efficiency: Causes of the Chinese famine”, China Economic Review, 9(2), pp.157-166.
- Chen Y., Zhou L., 2007, “The long-term health and economic consequences of the 1959-1961 famine in China”, Journal of Health Economics, 26(4), pp. 659-681.
- Coale A., 1984, Rapid Population Change in China, 1952-1982. Washington D.C., National Academy Press, 89 p.
- Coale A., Demeny P., 1983, Regional Model Life Tables and Stable Populations. New York, Academic Press, 496 p.
- Fan J., 1995, China Population Structure by age and Sex. Beijing, China Population Publishing House, 514 p.
- Fan Z., Meng L., 2005, “The summary of the Chinese famine of 1959-1961”, China Rural Survey, 60(1), pp. 61-71.
- Feeney G., Yu J., 1987, “Period parity progression measures of fertility in China”, Population Studies, 41(1), pp. 77-102.
- Hao H., Gao L., 1997, “Son preference and its effects on fertility in China”, in SFPCC and WHO CC 1992 National Fertility and Family Planning Survey, China – Selected Research Papers in English, Atlanta: Center for Disease Control and Prevention, pp. 55-98.
- Huang R., Liu Y., 1995, Mortality Data of China Population, Beijing, China Population Publishing House, 307 p.
- Houser D., Sands B., Xiao E., 2009, “Three parts natural, seven parts man-made: Bayesian analysis of China’s Great Leap Forward demographic disaster”, Journal of Economic Behavior and Organization, 69, pp. 148-159.
- Jin H., 1993, “A memorandum of the ‘three years of natural disasters’”, Society, Vol. 4-5, pp. 13-22.
- Johnson D.G., 1998, “China’s great famine: Introductory remarks”, China Economic Review, 9(2), pp.103-109.
- Johansson S, Nygren O., 1991, “The missing girls of China: A new demographic account”, Population and Development Review, 17(1), pp. 35-51.
- Jowett A. J., 1991, “The demographic responses to famine: The case of China 1958-1961”, Geo Journal, 23(2), pp.135-146.
- Kane P., 1988, Famine in China, 1959-61: Demographic and Social Implications, London, Palgrave Macmillan, 164 p.
- Kung J. K., Lin J. Y., 2003, “The causes of China’s Great Leap Famine, 1959-1961”,
- Economic Development and Cultural Change, 52(1), pp. 51-73.
- Lavely W., 1987, “Chinese demographic data: A guide to major sources”, The Australian Journal of Chinese Affairs, 18, pp. 167-178.
- Lee J, Wang F., Campbell C., 1994, “Infant and child mortality among the Qing nobility: Implications for two types of positive check”, Population Studies, 48(3), pp. 395-411.
- Li B., 1984, “Assessment of the accuracy of a sample survey”, in China Population Information Centre, Analysis on China’s National One-per-Thousand-Population Fertility Sample Survey, Beijing: China Population Information Centre, pp. 24-32.
- Li C., 1997, “Population changes caused by the Great Leap Forward”, Studies of the History of Chinese Communist Party, 2, pp. 1-14.
- Lin F., Wang F., 1991, “The examination of the quality of National Sample Survey on Fertility and Contraception”, Population Research, 1, pp. 3-7.
- Lin J.Y., Yang D. T., 1998, “On the causes of China’s agricultural crisis and the Great Leap Famine”, China Economic Review, 9(2), pp. 125-140.
- Lin J. Y., Yang D. T., 2000, “Food availability, entitlements and the Chinese Famine of 1959-61”, Economic Journal, 110(460), pp. 136-158.
- Luo Z., Mu R., Zhang X., 2006, “Famine and overweight in China”, Review of Agricultural Economics, 28(3), pp. 296-304.
- MacDonald A. L., 2003, “Famine in China”, in Demeny P. G and McNicoll G. (eds.) Encyclopedia of Population, New York: Macmillan Reference, pp. 388-390.
- Peng X., 1987, “Demographic consequences of the Great Leap Forward in China’s provinces”, Population and Development Review, 13(4), pp. 639-670.
- Riskin C., 1998, “Seven questions about the Chinese Famine of 1959-61”, China Economic Review, 9(2), pp. 111-124.
- Sen A., 1981, Poverty and Famines: An Essay on Entitlement and Deprivation. Oxford, Clarendon Press, 257 p.
- Song S., 2009, “Does famine have a long-term effect on cohort mortality? Evidence from the 1959-1961 Great Leap Forward famine in China”, Journal of Biosocial Sciences, 41(4), pp. 469-491.
- Song S., Wang W., Hu P., 2009, “Famine, death, and madness: Schizophrenia in early adulthood after prenatal exposure to the Chinese Great Leap Forward Famine”, Social Science & Medicine, 68(7), pp. 1315-1321.
- The Census Office of the State Council and The Division of Population Statistics of National Bureau of Statistics, 1982, The Major Results of China’s Third Census. Beijing: China’s Statistics Press, 55 p.
- Wang Y., Wang X., Kong Y., Zhang J.H., Zeng Q., 2010, “The Great Chinese Famine Leads to Shorter and Overweight Females in Chongqing Chinese Population After 50 Years”, Obesity, 18(3), pp. 588-592.
- Wolf A.P., 1985, “Fertility in prerevolutionary rural China”, in Hanley S.B., Wolf A.P, (eds.) Family and population in East Asian history, Stanford: Stanford University Press, pp. 154-185.
- Yang J., 2008b, Tombstone: An Account of Chinese Famine in the 1960s, Hong Kong, Cosmos Books, 1095 p.
- Yang D., Su F., 1998, “The politics of famine and reform in rural China”, China Economic Review, 9(2), pp. 141-156.
- Yang D., 2008a, “China’s agricultural crisis and famine of 1959-1961: A survey and comparison to Soviet famines”, Comparative Economic Studies, 50, pp. 1-29.
- Yang J., 2008b, Tombstone: An Account of Chinese Famine in the 1960s, Hong Kong, Cosmos Books, 1095 p.
- Yao X.,Yin H., 1994, “Basic Data of China’s Population”, Beijing, China Population Publishing House, 151 p.
- Yao S., 1999, “A note on the causal factors of China’s famine in 1959-1961”, Journal of Political Economy, 107(6), pp. 1365-1369.
- Zhao X., 1989, “A survey of China’s birth and birth control”, Sciences and Technology Review, 4, pp. 6-7.
- Zhao Z., 1997a, “Deliberate birth control under a high-fertility regime: Reproductive behaviour in China before 1970”, Population and Development Review, 23(4), pp. 729-767.
- Zhao Z., 1997b, “Demographic systems in historic China: Some new findings from recent research”, Journal of the Australian Population Association, 14(2), pp. 201-232.
- Zhao Z., 2006, “Towards a better understanding of past fertility regimes: Ideas and practice of controlling family size in Chinese history”, Continuity and Change, 21(1), pp. 9-35.
- Zhuang Y., 1994, Migration Data of China, Beijing, China Population Publishing House, 288 p.
Publisher keywords: China, demographic consequence, demographic response, famine, fertility, fertility determinants, marriage, mortality

This article is available in open access under our model Subscribe To Open.
Uploaded: 12/17/2012
https://doi.org/10.3917/popu.1202.0329